
A researcher's guide to TCR/BCR repertoire analysis: tools and workflows
A data-driven comparison of clonotyping engines and analysis platforms for bulk and single cell immune repertoire studies
Introduction: choosing the right tool for your V(D)J analysis
If you're analyzing T-cell and B-cell receptor repertoires, you already know the stakes: choosing the wrong tool can lead to inaccurate results or weeks of delays. The core challenge isn't just the data complexity from V(D)J recombination and somatic hypermutation—it's navigating a fragmented landscape of bioinformatics tools.
This guide cuts through the confusion by comparing the leading tools at each stage of your analysis:
Upstream Analysis (Clonotyping Engine): the algorithm that reconstructs receptor sequences from raw data — accuracy here is foundational
Downstream Analysis (Discovery Environment): where you turn clonotypes into biological insights
We'll show you the data-driven path to the best solution for your research, backed by both vendor benchmarks and independent academic studies.
Part I: Upstream analysis - a head-to-head comparison of clonotyping engines
The reliability of any repertoire study depends on your clonotyping engine's performance. Inaccuracies at this step affect all downstream analyses [1]. This section provides a data-driven comparison of the leading engines for both bulk and single-cell sequencing.
1.1 Bulk sequencing analysis: speed and accuracy matter
For bulk V(D)J sequencing, the main command-line tools are:
MiXCR: https://github.com/milaboratory/mixcr
Immcantation suite: https://github.com/immcantation
TRUST4: https://github.com/liulab-dfci/TRUST4
While they all aim to solve the same problem, benchmark data reveals critical differences.
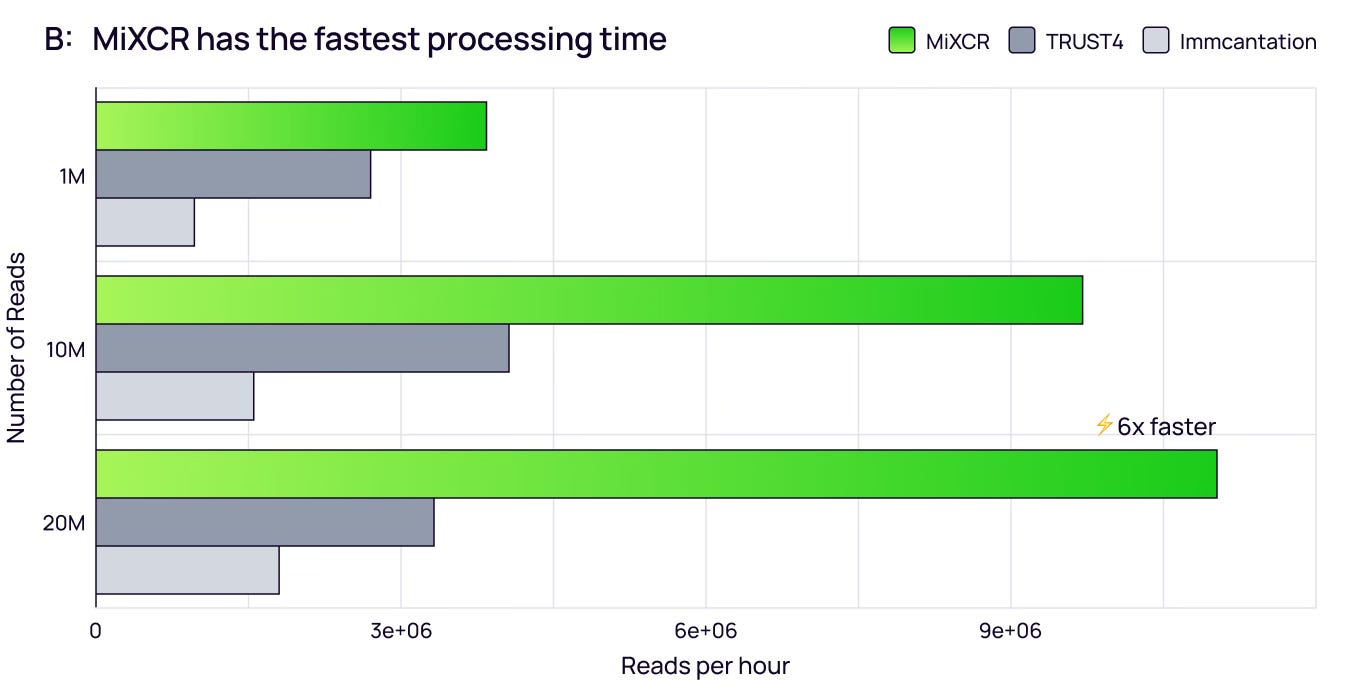
Computational Speed
In large-scale studies, processing time is crucial. MiXCR completes analysis of a 20-million-read dataset in under 2 hours, while Immcantation requires over 10 hours — making MiXCR up to 6-fold faster [2].
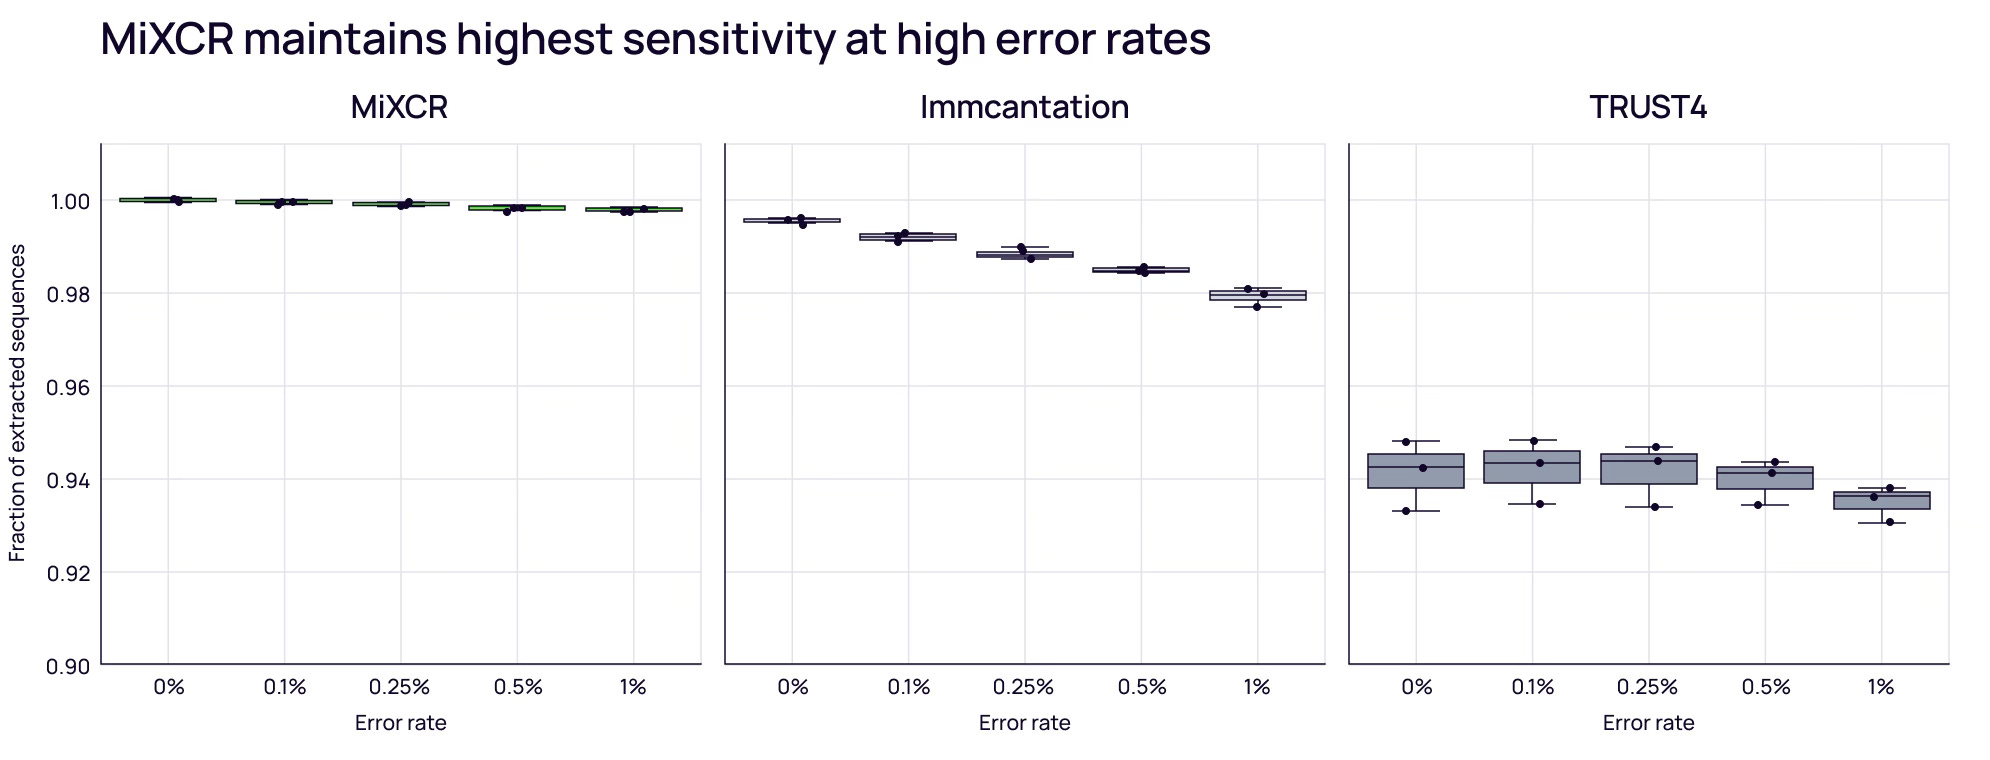
Accuracy and Sensitivity
More importantly, you need correct clonotype identification (sensitivity) while avoiding artifacts (specificity). Using simulated datasets, MiXCR shows the highest sensitivity — an advantage that grows as sequencing error rates increase [3].
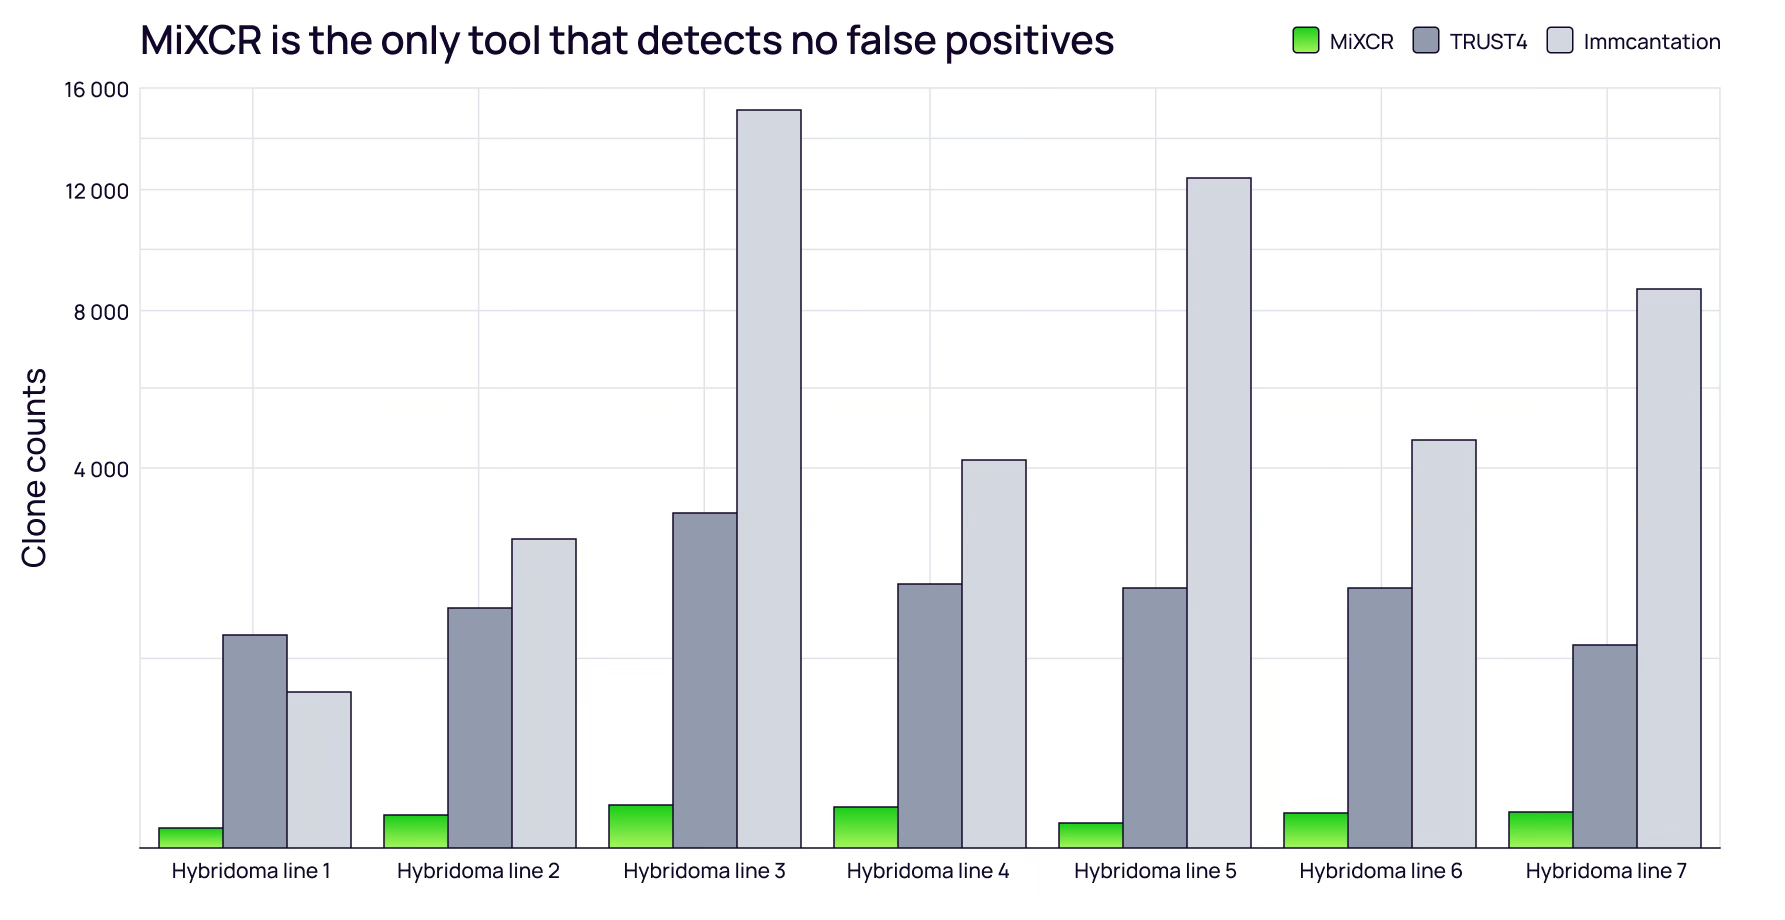
MiXCR excels at minimizing false positives. Analysis of monoclonal hybridoma datasets (where only a few B-cell clones should exist) showed MiXCR correctly identified minimal clones. In contrast, TRUST4 reported ~20x more clones, and Immcantation reported 100-200x more.
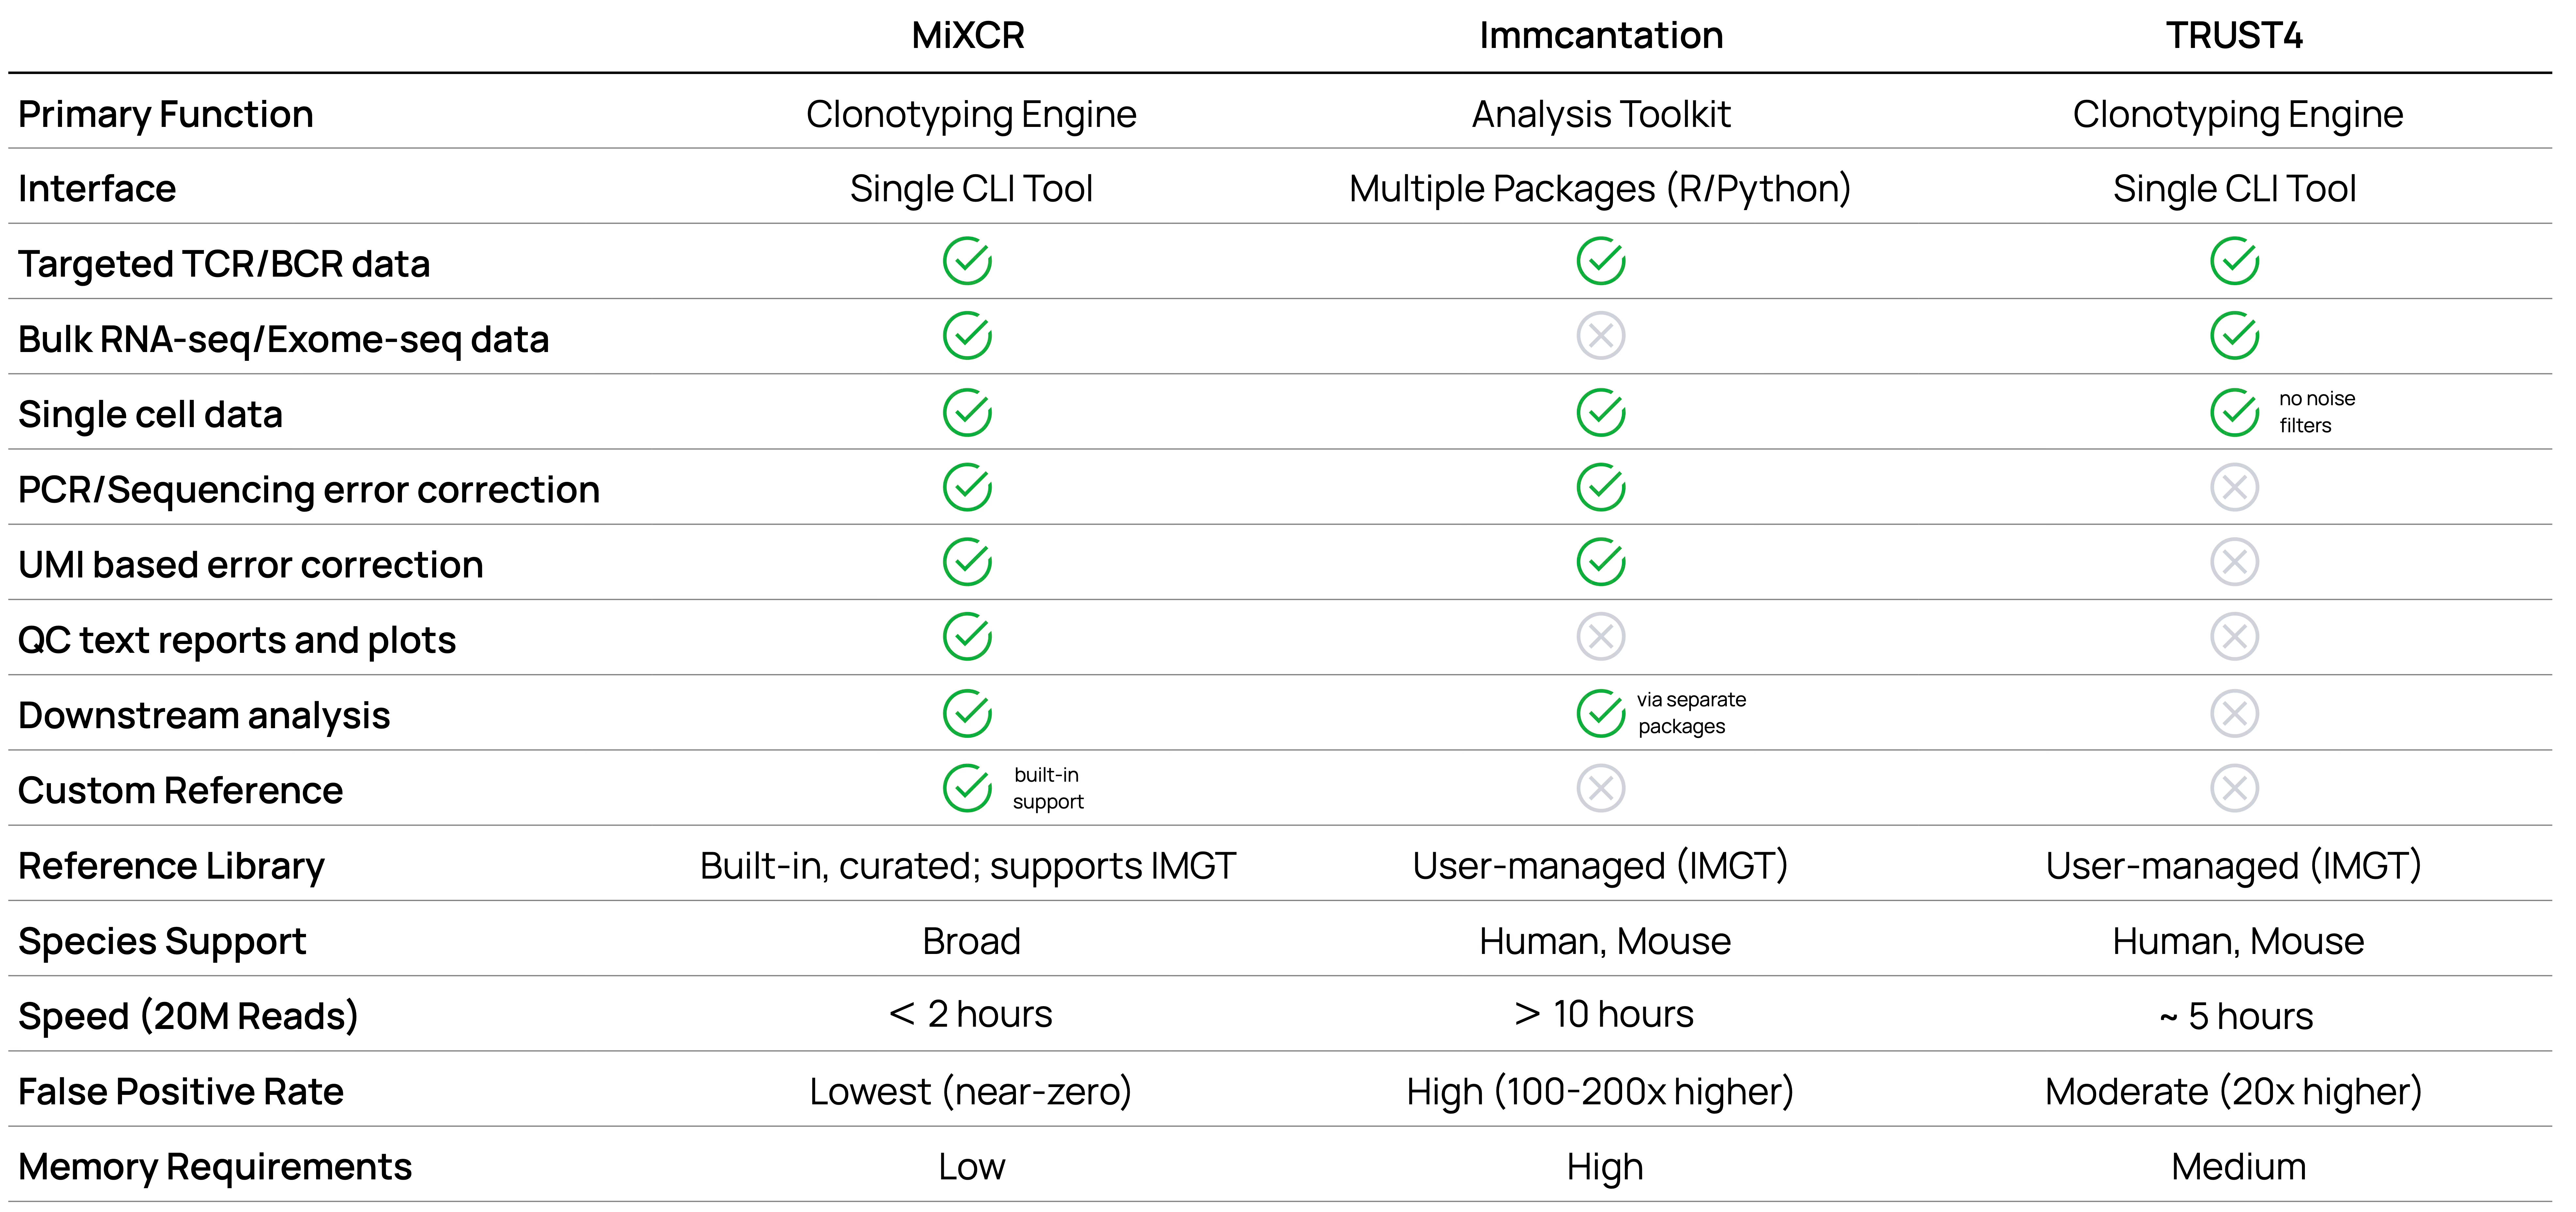
Feature comparison
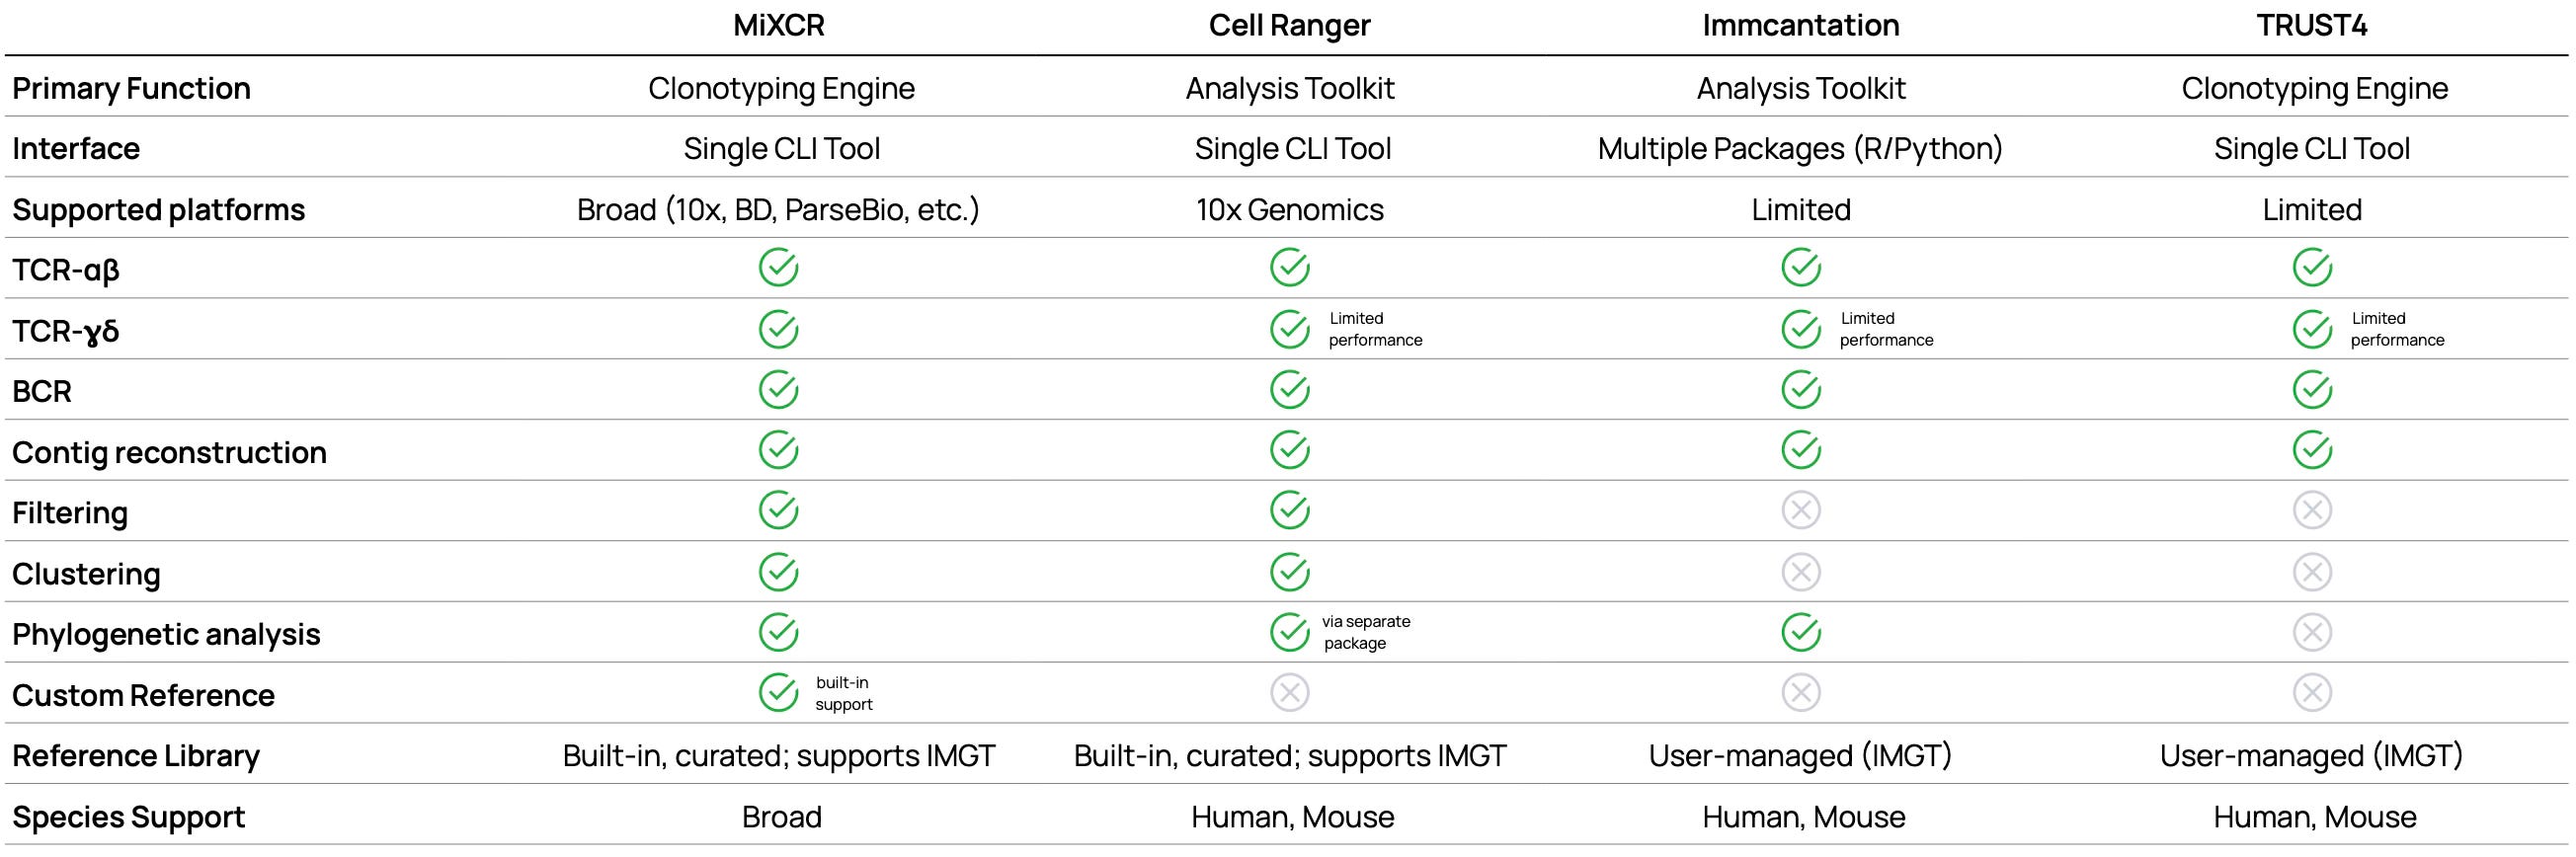
Beyond speed and accuracy metrics, practical features determine a tool's real-world utility. The following comparison table shows key differences in capabilities, from basic functionality to advanced features like custom allele discovery or phylogenetic analysis.
1.2 Single-cell analysis: getting the most from every cell
For single-cell V(D)J analysis, the goal is reliably linking paired receptor sequences to transcriptomic profiles. The primary comparison here focuses on MiXCR versus the platform-default 10x Genomics Cell Ranger. While TRUST4 technically supports single-cell data [5], we exclude it from this comparison because it lacks noise filters — resulting in reports of ~10x more "cells" that are actually technological artifacts rather than real cells. This makes meaningful performance comparison impossible.
Cell Detection Efficiency
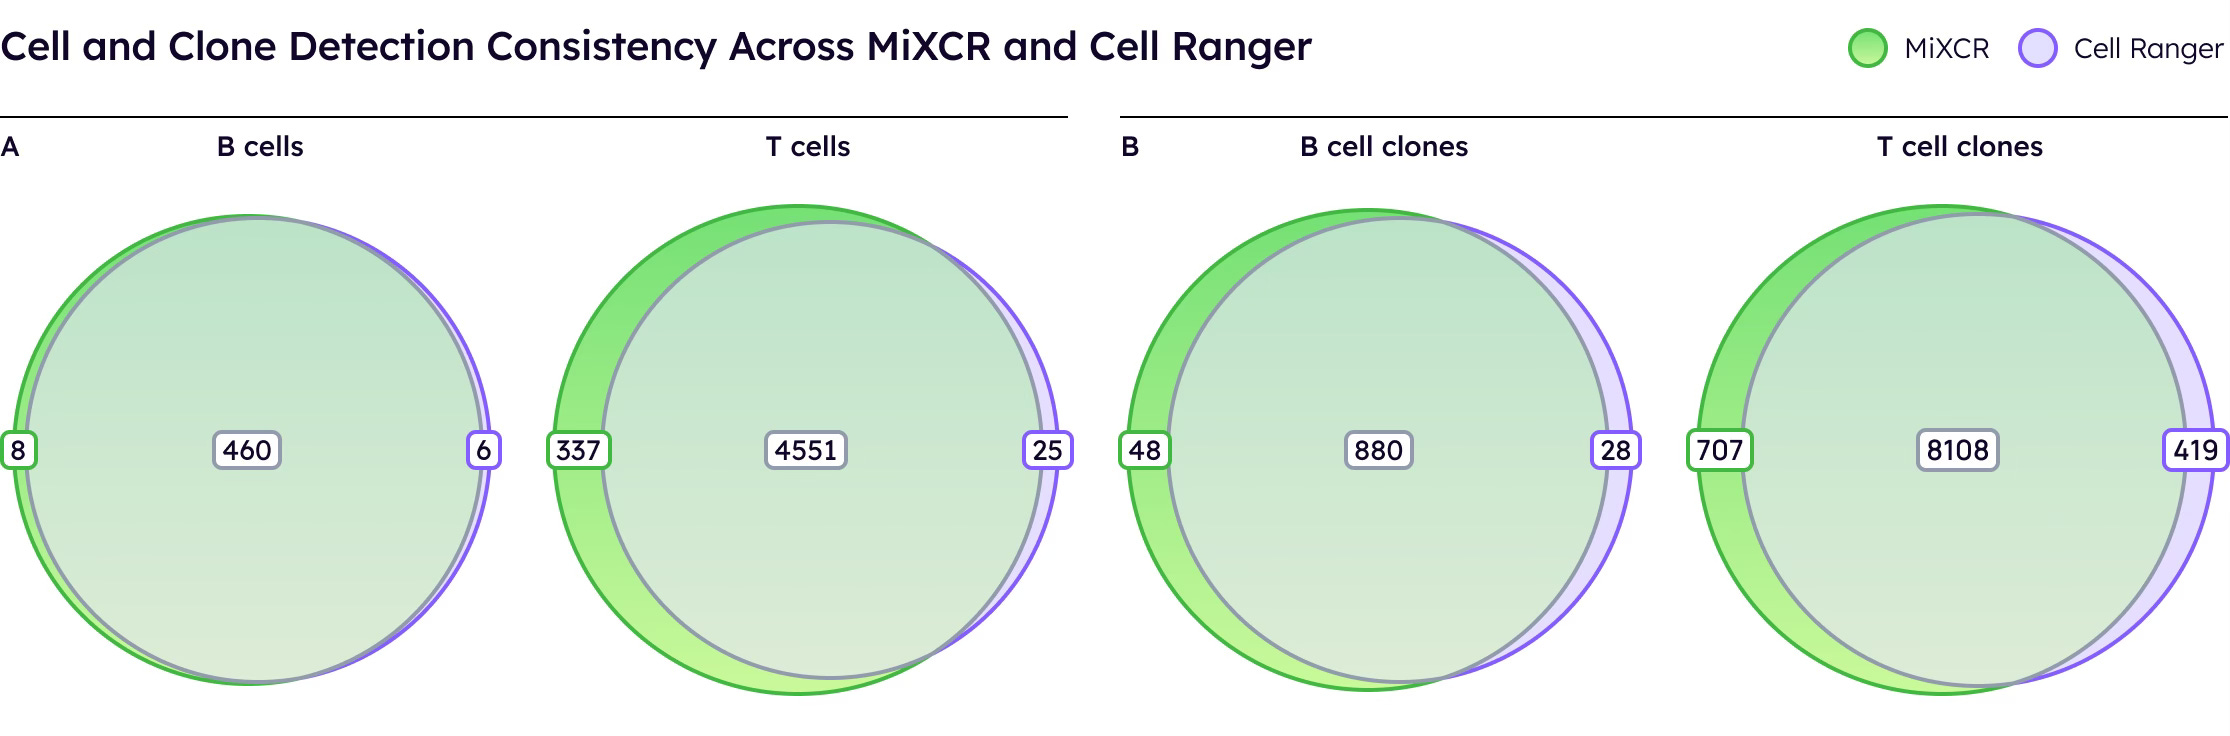
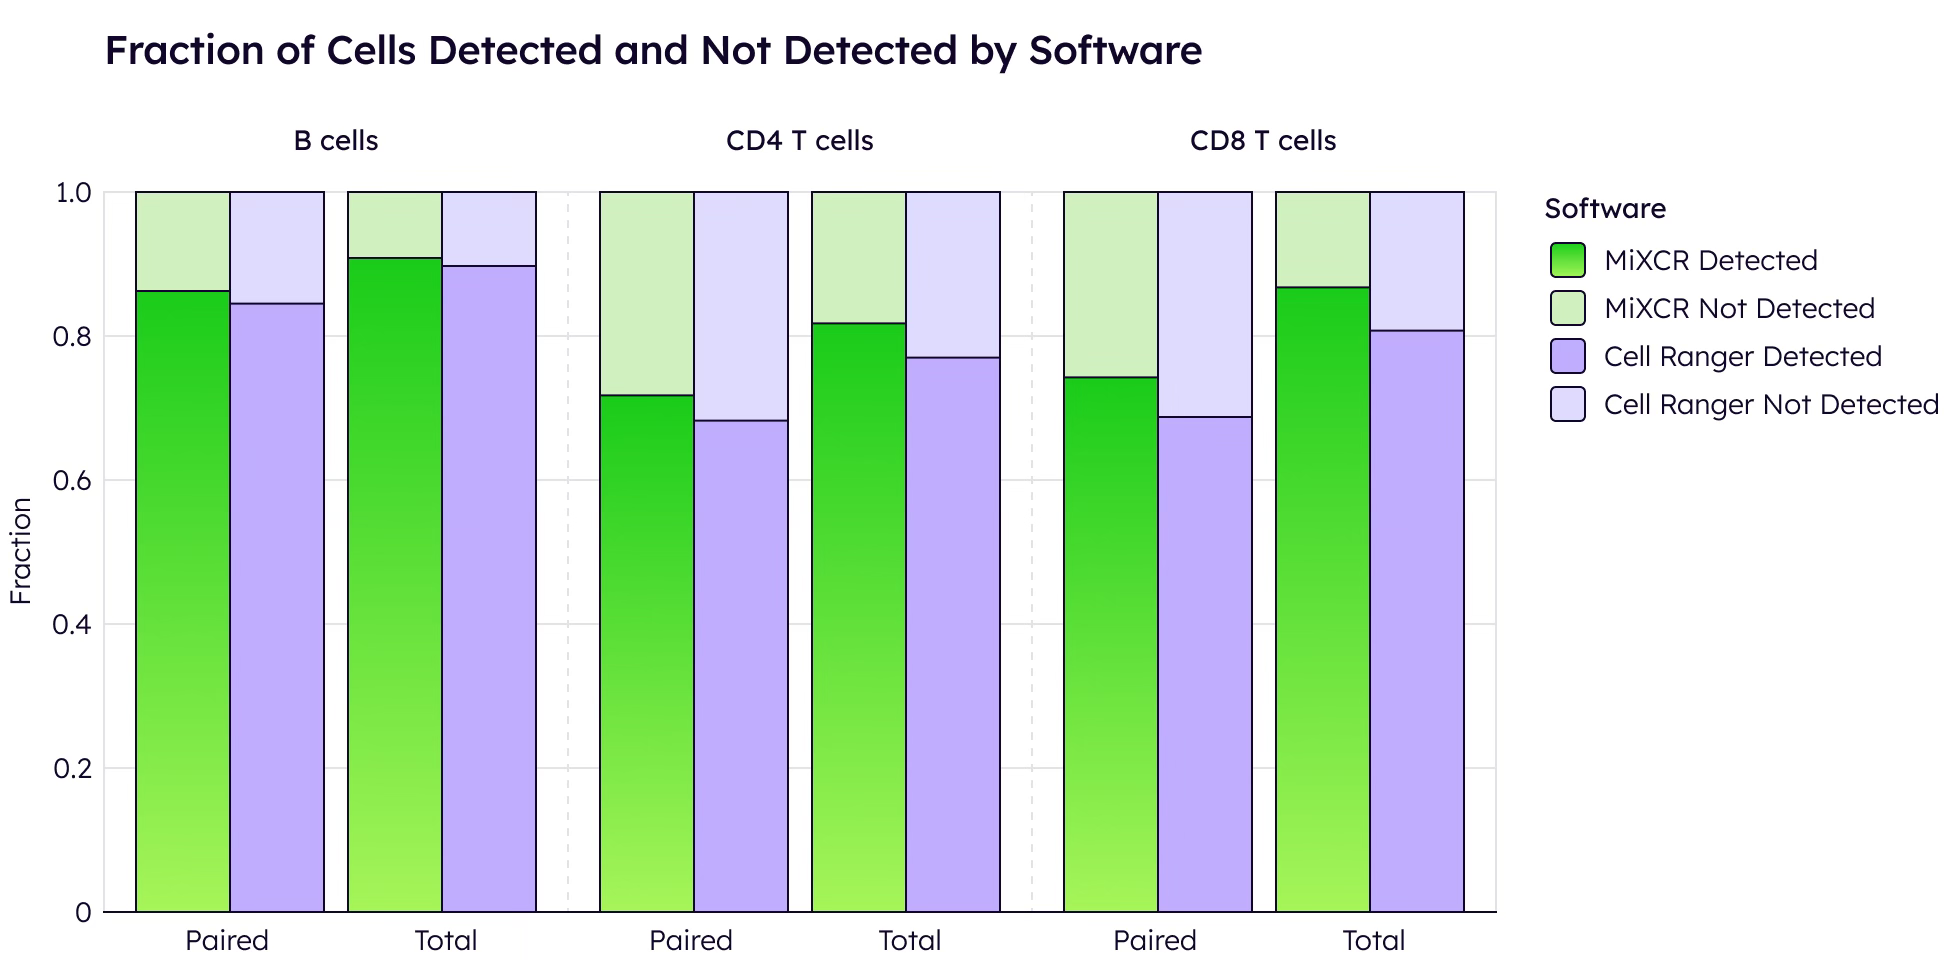
The key metric is how many cells yield productive, paired receptors [1, 6]. On public 10x datasets under standard conditions, MiXCR and Cell Ranger perform comparably, identifying similar numbers of T and B cells with productive receptors.
Both tools demonstrate robust performance when sufficient sequencing depth is available.
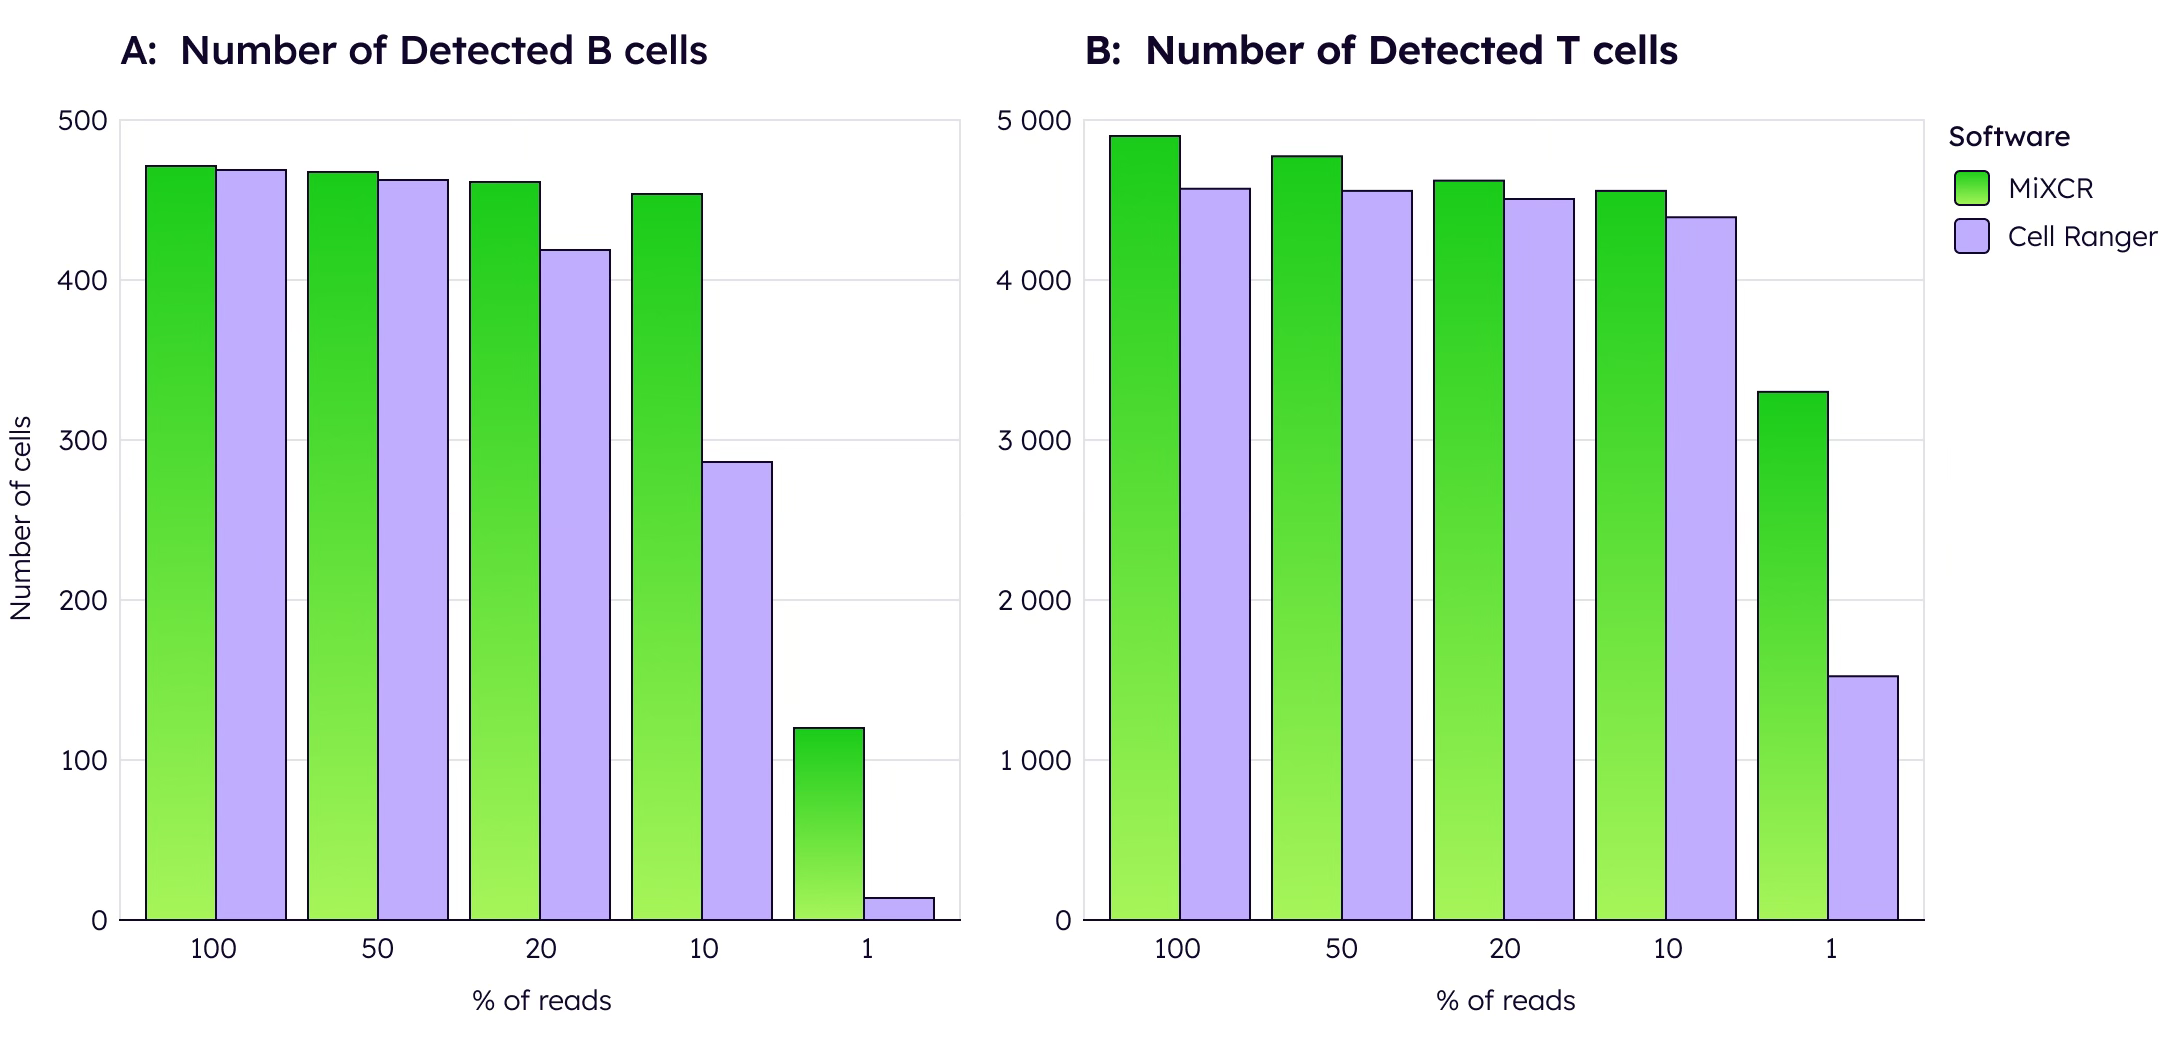
However, MiXCR's true advantage emerges with low-read data. When computationally downsampled to 50% of original reads, MiXCR maintains significantly higher cell detection rates than Cell Ranger, whose performance degrades substantially. This robustness is critical for real-world applications, allowing researchers to multiplex more samples per run and significantly reduce per-sample costs without sacrificing data quality.
Feature comparison
Single-cell V(D)J analysis demands specialized capabilities beyond standard clonotyping. The following comparison highlights key differences in platform support, species coverage, and advanced features that directly impact experimental design and analysis options.
1.3 Reference libraries: the hidden factor in analysis accuracy
Accurate V(D)J annotation depends entirely on germline reference quality. Most tools rely on IMGT, which has known limitations: slow updates, population bias and incomplete allele coverage. Using an incomplete reference causes cascading errors —germline polymorphisms get misidentified as somatic mutations, and novel alleles force incorrect alignments.
How tools handle references
MiXCR: built-in curated library with continuous updates, automatic novel allele discovery (
findAlleles), and custom library creation (buildLibrary)Immcantation: TIgGER for allele inference, but requires manual reference management [4]
Cell Ranger:
mkvdjreffor custom references, limited to 10x dataTRUST4: User-provided references only, no discovery capability
The difference is critical: studies show that using population-matched references with allele discovery can recover 15-20% more productive sequences than static IMGT-only approaches. For non-European populations or rare alleles, this difference determines whether you capture real biological diversity or introduce systematic bias.
Part II: Downstream analysis - from clonotypes to discovery
Accurate clonotypes are just the beginning. Real discoveries come from downstream analysis: identifying tumor-reactive clones, tracing B-cell evolution, or linking clonotype to cell phenotype. Here, researchers face a choice between powerful but complex command-line tools and more accessible graphical interfaces.
2.1 Command-line pipelines: power with complexity
Command-line interfaces offer unmatched control. MiXCR and the Immcantation suite (multiple R/Python packages) allow granular analysis and custom scripting [4, 7]. However, for bench scientists, this requires coding skills in multiple languages. Even basic tasks like merging V(D)J data with gene expression require custom scripts — a major bottleneck [1].
2.2 Graphical user interfaces: accessibility vs. functionality
General-purpose suites like Geneious offer point-and-click interfaces, lowering barriers for non-coders. However, they face critical limitations for NGS analysis: lack of dedicated backend infrastructure means datasets above ~100,000 sequences cause performance degradation or crashes. The platform requires manual data transfer between modules, lacks specialized immune analysis functions (no built-in clonotyping engine, V(D)J assignment, or clonality analysis), and cannot handle the millions of sequences typical in modern NGS experiments.
Web-based platforms like Galaxy provide web-based access to command-line tools, including immune repertoire pipelines like IGGalaxy and pRESTO implementations [8, 9]. While more accessible than pure CLI, functionality depends entirely on which tools administrators have installed. Processing large NGS datasets requires significant server resources - a standard Galaxy instance struggles with datasets >1GB. Additionally, users must chain together multiple independent tools manually, creating opportunities for errors and increasing analysis time.
2.3 The integrated solution - Platforma's unified approach
The ideal solution combines a top-tier clonotyping engine with a seamless, no-code environment designed for immunologists. Platforma achieves this by integrating the benchmark-proven MiXCR engine with an intuitive workflow for complete repertoire analysis.
Platforma's innovation is its ecosystem of interconnected "Blocks" that transform fragmented workflows into fluid, interactive discovery. Each block handles specific analysis tasks while seamlessly passing data to others, creating fluid workflows impossible with traditional tools.
Deep downstream analysis
Where other tools stop at basic clonotype counting, Platforma enables sophisticated biological discovery. Its Clonotype Space block reveals repertoire architecture and functional clusters through interactive high-dimensional analysis. For antibody researchers, automated SHM tree construction traces maturation pathways and identifies key mutations driving affinity improvement. Clone tracking across timepoints, tissues, or treatments becomes straightforward with integrated metadata management — no more Excel gymnastics to follow clonal dynamics.
AI-powered discovery tools
Platforma uniquely includes built-in machine learning models that transform repertoire analysis from descriptive to predictive. Specificity prediction identifies likely antigen targets without experimental screening, while affinity estimation ranks candidates by predicted binding strength. For therapeutic development, developability assessment flags potential manufacturing issues early, and tumor reactivity scoring prioritizes TCRs likely to recognize cancer antigens.
Effortless V(D)J Analysis - Watch Platforma transform millions of clonotypes into publication-ready plots in seconds. See dynamic grouping across 60 samples, real-time customization, and statistical analysis revealing immunization peaks — all with just a few clicks.
Conclusion: making the right choice for your research
TCR/BCR repertoire analysis demands both accurate upstream clonotyping and efficient downstream discovery tools. The data shows MiXCR as the best engine for speed, accuracy, and versatility. When choosing a complete solution, consider your analysis environment equally.
While command-line tools offer power to coding experts and generalist GUIs provide basic accessibility, Platforma represents the evolution of repertoire analysis. By integrating the leading MiXCR engine into a comprehensive, no-code discovery environment with unique AI capabilities, it provides the most powerful and accessible end-to-end solution — accelerating the journey from raw data to immunological discoveries.
Platforma is free for academic researchers - get started today.
References
Irac, S. E., Soon, M. S. F., Borcherding, N., & Tuong, Z. K. (2024). Single-cell immune repertoire analysis. Nature Methods, 21(5), 777–792.
Bolotin, D. A., et al. (2015). MiXCR: software for comprehensive adaptive immunity profiling. Nature Methods, 12(5), 380-381.
Barennes, P., et al. (2020). Benchmarking of T cell receptor repertoire profiling methods reveals large systematic biases. Nature Biotechnology, 38(10), 1215-1224.
Gupta, N. T., et al. (2017). Change-O: a toolkit for analyzing large-scale B cell immunoglobulin repertoire sequencing data. Bioinformatics, 31(20), 3356-3358.
Song, L., et al. (2021). TRUST4: immune repertoire reconstruction from bulk and single-cell RNA-seq data. Nature Methods, 18(6), 627-630.
Andreani, T., et al. (2022). Benchmarking computational methods for B-cell receptor reconstruction from single-cell RNA-seq data. NAR Genomics and Bioinformatics, 4(3), lqac049.
Vander Heiden, J. A., et al. (2014). pRESTO: a toolkit for processing high-throughput sequencing raw reads of lymphocyte receptor repertoires. Bioinformatics, 30(13), 1930-1932.
Afgan, E., et al. (2018). The Galaxy platform for accessible, reproducible and collaborative biomedical analyses. Nucleic Acids Research.
van der Loo, B., et al. (2021). Antigen Receptor Galaxy: A User-Friendly, Web-Based Tool for Analysis and Visualization of T and B Cell Receptor Repertoire Data. The Journal of Immunology.