How to Analyze TCR/BCR Repertoire Diversity and Clonality
Learn what immune repertoire diversity is, key clonality metrics, why downsampling matters, and how to visualize TCR/BCR repertoires for immune profiling.
The adaptive immune system relies on a vast collection of T-cell receptors (TCRs) and B-cell receptors (BCRs), collectively known as the immune repertoire. Understanding this repertoire is essential for evaluating immune competence, monitoring disease, and tracking therapeutic responses.
What are diversity and clonality?
Two key concepts—diversity and clonality—are central to repertoire analysis.
Diversity reflects the number and distribution of unique clonotypes in a sample. A broad, evenly distributed repertoire generally indicates immune health and flexibility.
Clonality describes dominance by a small subset of clonotypes. This is often seen during infection, after vaccination, or in cancer, where specific immune responses drive the expansion of a few clones.
Analyzing both metrics together provides a detailed view of immune status, allowing researchers to answer questions about richness, balance, and immune reactivity.
What metrics are used to measure diversity and clonality?
Different biological questions call for different diversity and clonality metrics:
Selecting the right mix of metrics ensures your analysis aligns with your research goals, whether you are comparing treatment groups, tracking vaccine responses, or screening large patient cohorts.
Why is downsampling important in repertoire analysis?
Comparisons across samples with unequal sequencing depths can be misleading. More reads almost always reveal more clonotypes. Downsampling corrects this bias by normalizing datasets to the same effective size.
Common approaches include:
Random Sampling – The most rigorous method; selects equal numbers of reads/UMIs across samples.
Auto/Min – Automatically set to the largest possible depth that includes all samples, or the size of the smallest sample.
Fixed Depth – Manually set to a defined threshold for reproducibility.
Top N / Cumulative Top – Focus on dominant clones rather than overall diversity. Useful for clonality analyses but should not replace true normalization.
For most studies, random sampling (auto or min) provides the fairest basis for comparing repertoires across conditions.
Practical Scenarios and Recommendations
How can I visualize repertoire diversity?
The most powerful way to interpret diversity is through visualization.
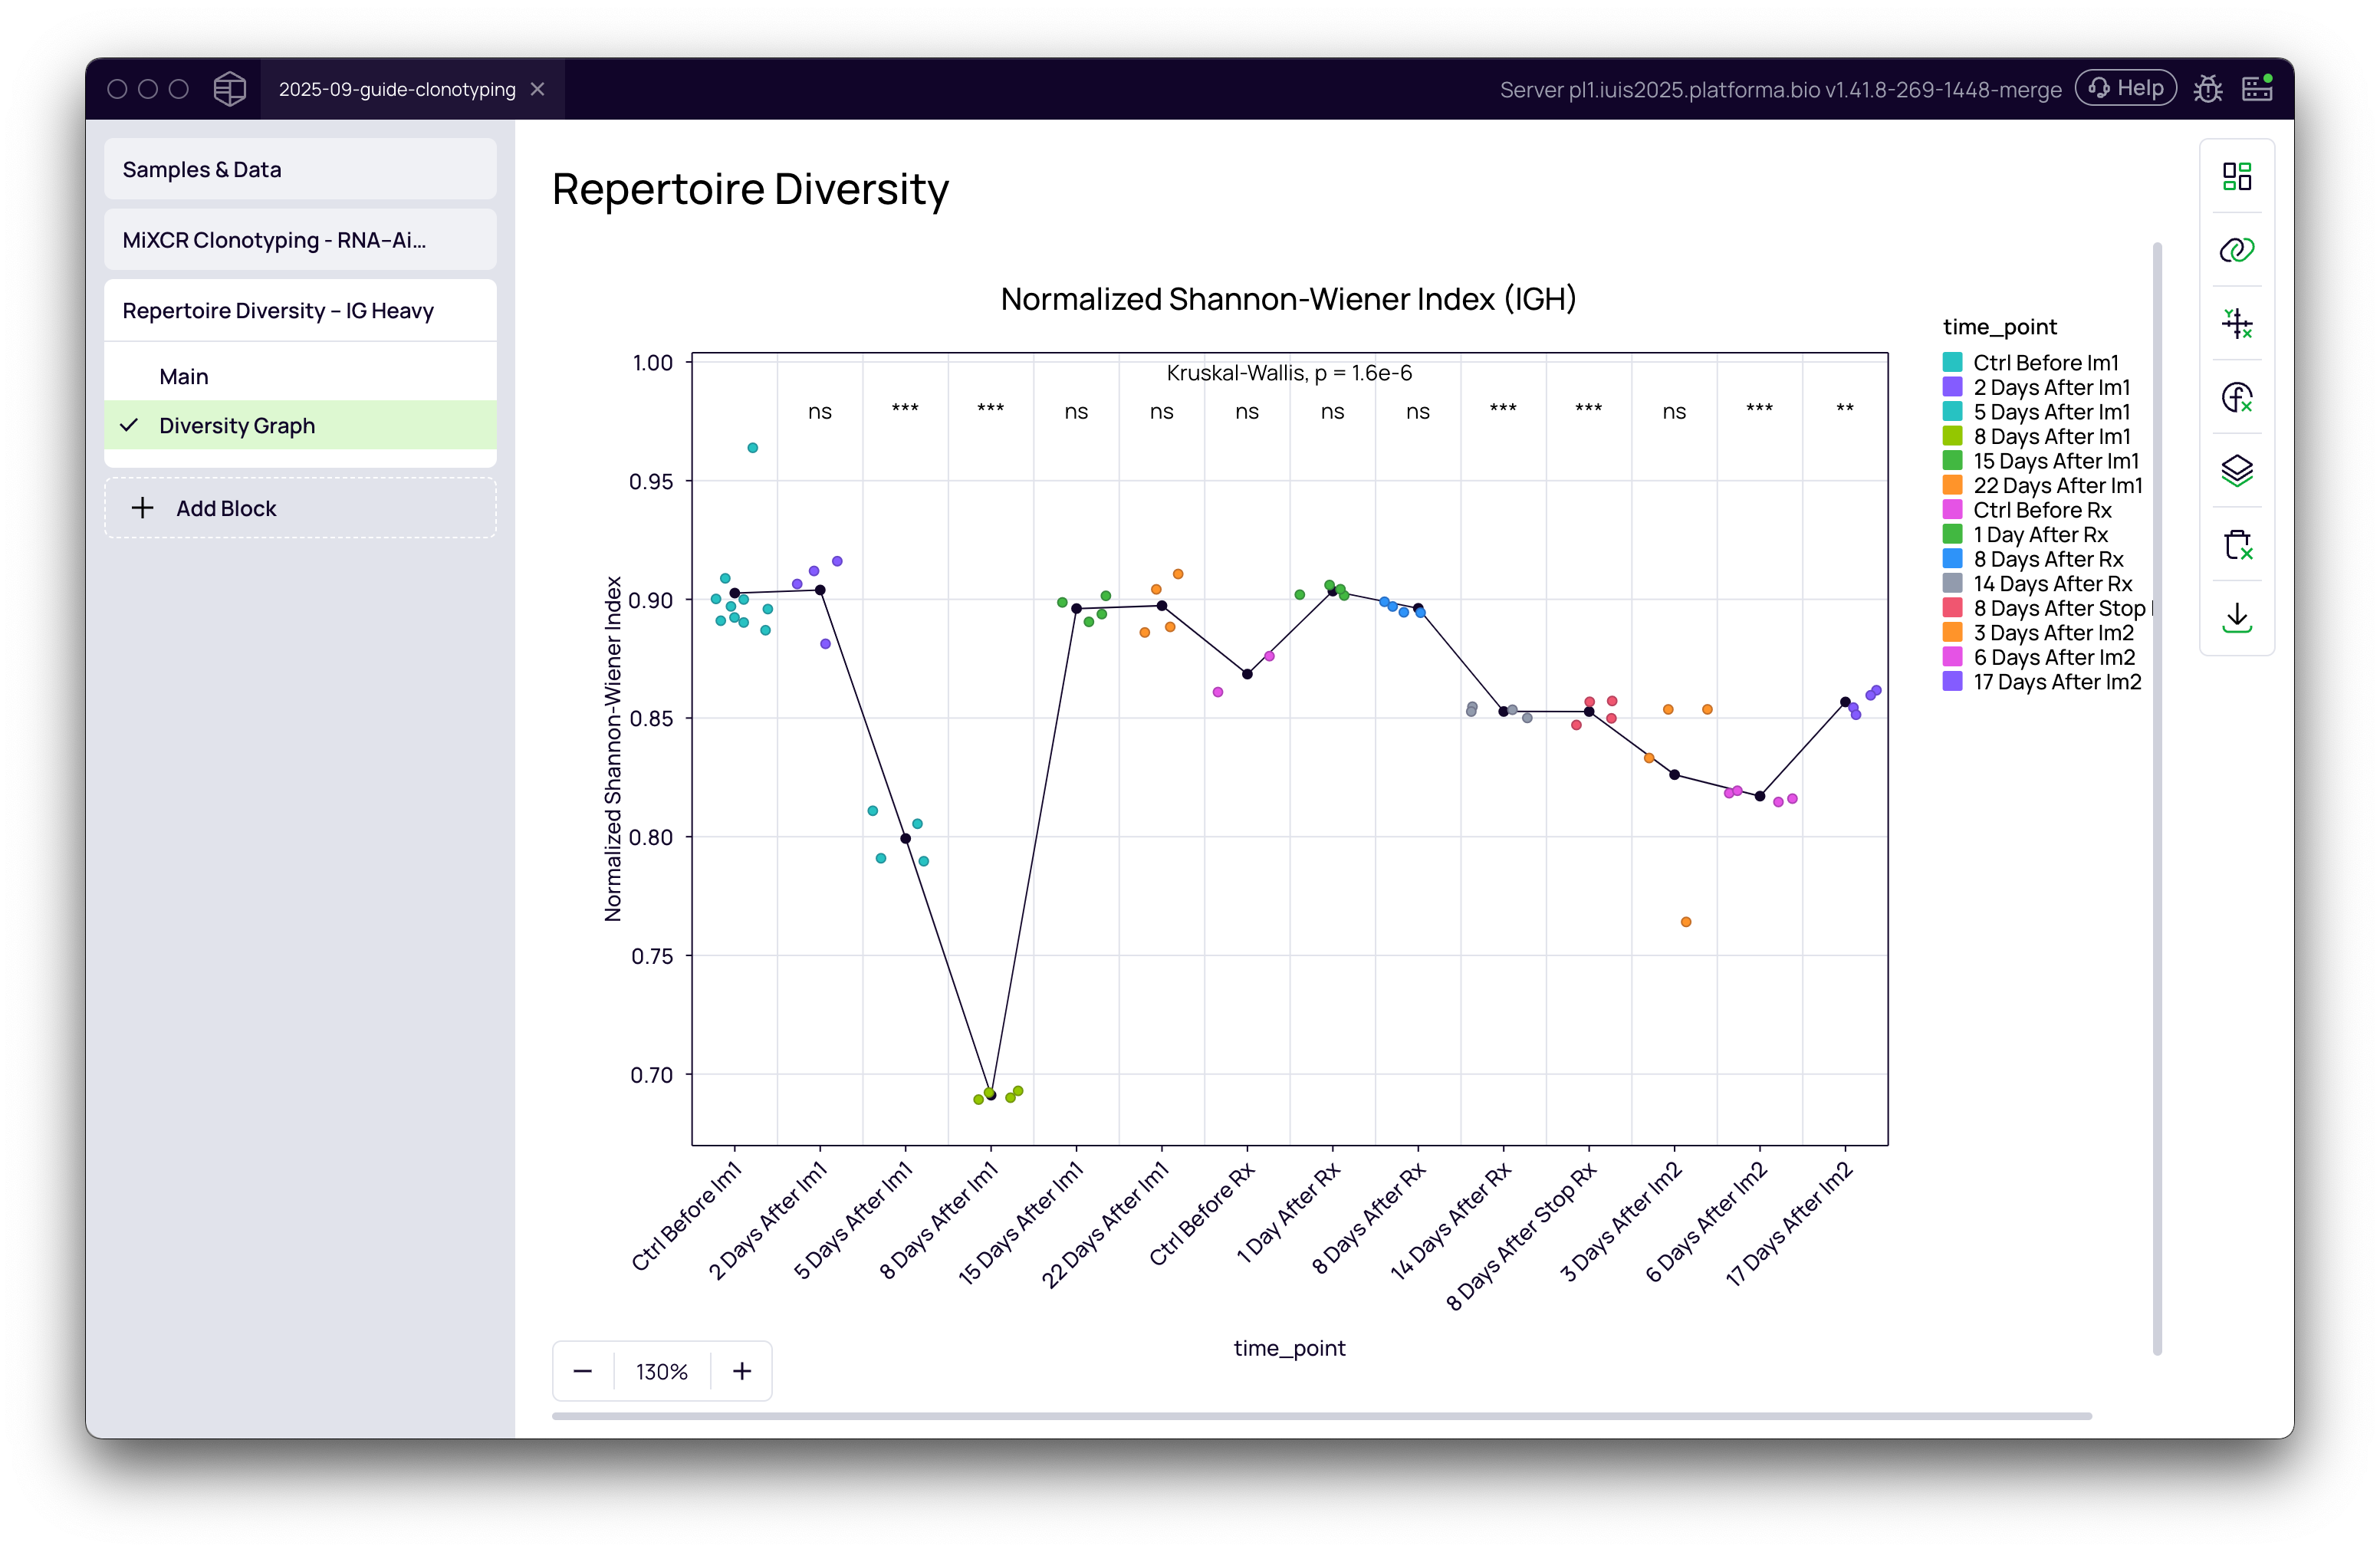
Line plots capture temporal changes in clonality or diversity.
Boxplots/violins reveal group-level differences.
Significance overlays (e.g., Wilcoxon or Kruskal-Wallis tests) validate observed trends.
These graphical outputs make it easier to identify biological patterns, compare experimental groups, and generate publication-ready figures.
Putting It All Together
Repertoire diversity analysis bridges raw sequencing data with actionable insights into immune function. By carefully selecting metrics, applying proper normalization, and visualizing results effectively, researchers can:
Detect signs of immunodeficiency or dysregulation.
Track immune responses to vaccination, infection, or therapy.
Benchmark diversity across patient groups or experimental conditions.
To streamline this process, Platforma, a no-code bioinformatics platform, integrates clonotyping, diversity calculation, normalization strategies, and visualization into drag-and-drop blocks, enabling researchers to transform sequencing data to immune repertoire insights without the technical bottleneck.
Leverage the Repertoire Diversity block and the Graph Maker in Platforma to generate publication-quality visualizations of your immune repertoire dynamics in just a few clicks.