
The State of Immune Repertoire Analysis: Key TCR/BCR Sequencing Trends Shaping the Next Era
We analyzed metadata from over 3.5 million processed samples from 2024–2025. Here is what the data tells us about the future of immunology.
Over the past decade, immune repertoire studies have evolved from niche research projects into the backbone of modern data analysis across continents and industries. As the developers of MiXCR—a widely adopted software for immunomics—we have a broad view of the landscape.
Between 2024 and 2025, our ecosystem processed metadata from over 3.5 million distinct samples, representing more than 3.2 petabytes of data.
To clarify this scale, we must stratify the data: 'Primary Targeted Sequencing' (dedicated TCR/BCR runs) versus 'Secondary Data Mining' (repertoire extraction from bulk RNA-seq and historical data). While the former drives high-fidelity clinical insights, our unique ability to unlock immune signals from standard RNA-seq accounts for the massive scale of the latter.
This article summarizes the key trends we have observed across this massive dataset. A critical note on scope: This report analyzes metadata from the MiXCR ecosystem. While MiXCR is a widely cited standard in academic immune repertoire sequencing, this dataset does not capture data processed exclusively through closed proprietary platforms (e.g., Adaptive Biotechnologies) or alternative open-source pipelines. Therefore, ‘Global Trends’ refers specifically to the trends observed within our extensive, cross-continental user base, which serves as a robust proxy for the broader open-science market.
Here is what the data tells us about the future of immunology.
The Data Explosion: A Trajectory of Scale
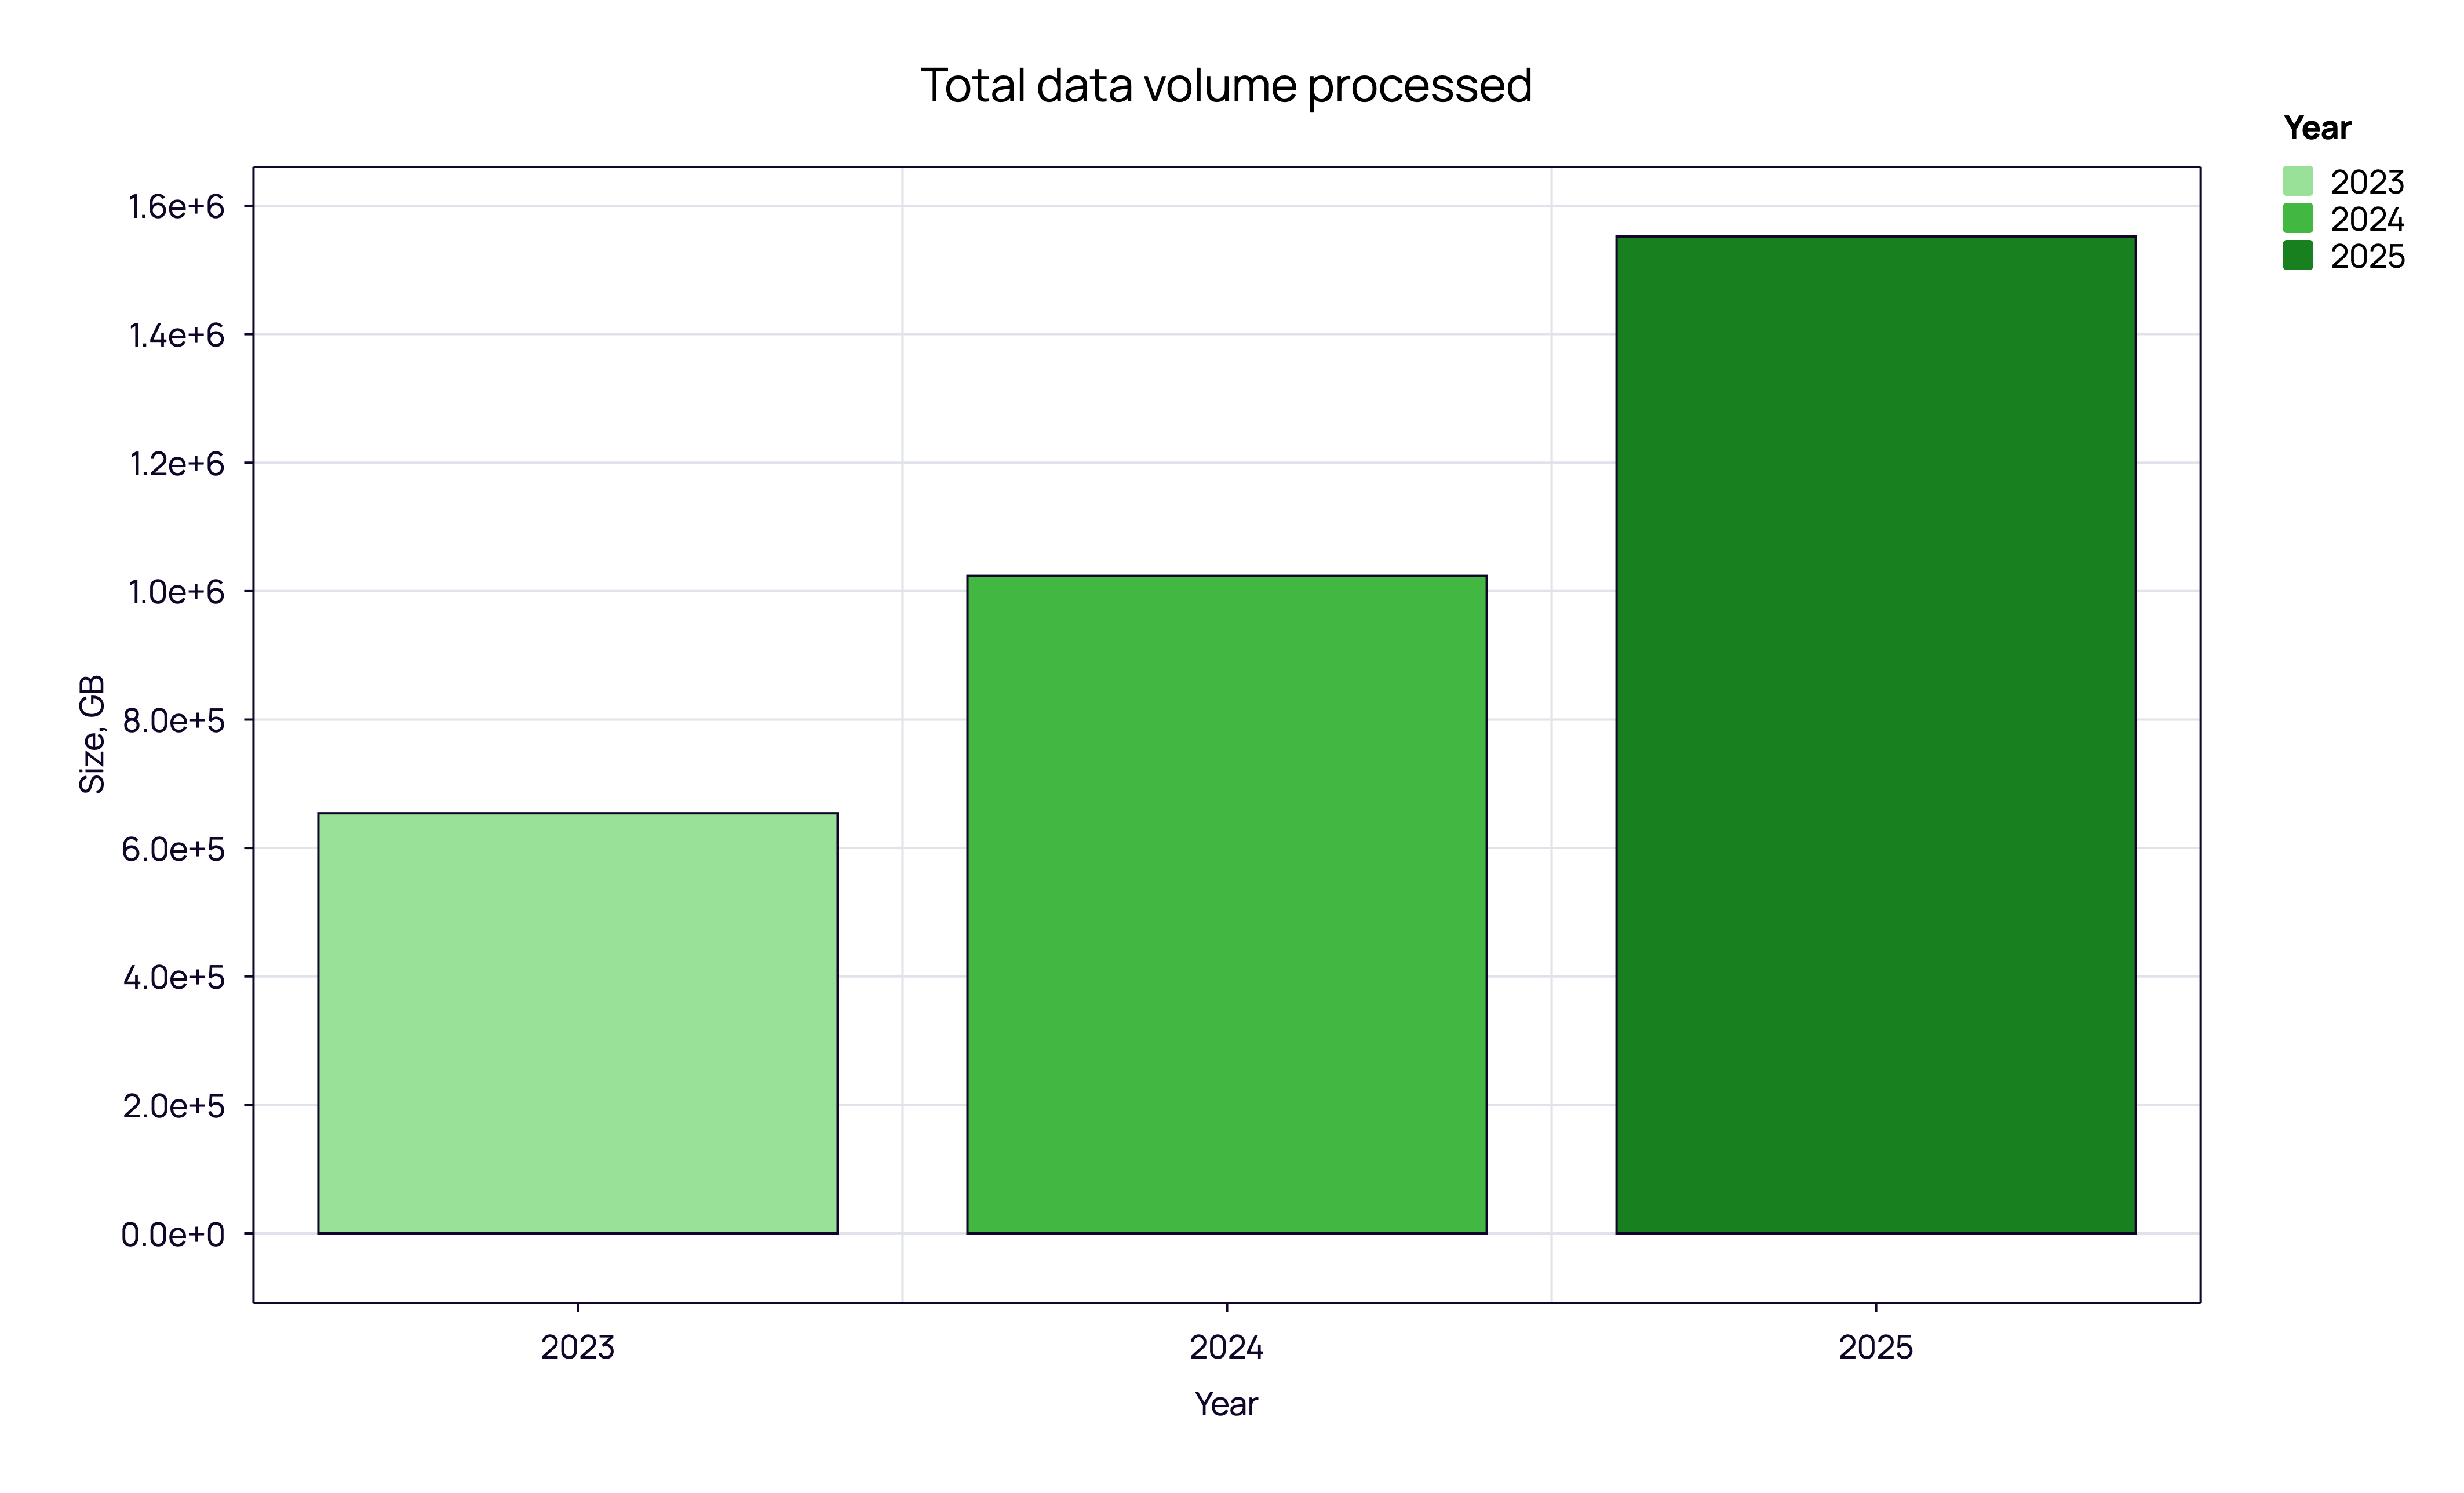
The total volume of TCR and BCR sequencing data has shown a consistent upward trajectory. In 2023, the total data volume processed was approximately 0.65 PB. This figure grew to roughly 1.0 PB in 2024 and reached over 1.5 PB in 2025.
Note on Methodology: We distinguish ‘Unique Samples’ from ‘Total Processing Volume.’ A portion of this volume stems from distinct re-analyses of public datasets (e.g., TCGA) to validate internal pipelines.
What does 1.5 Petabytes actually mean? Beyond the sheer storage, this metric validates the compute intensity of the modern immune pipeline. This surge from 1.0 to 1.5 PB isn’t just about data storage; it represents a fundamental shift in utility. We are seeing the transition from “discovery-mode” (smaller, targeted datasets) to “screening-mode” (massive, high-throughput comparisons). The industry is moving from asking “What does this receptor look like?” to asking “How does this repertoire interact with a population?”
While North America remains our largest user base, the “science of sequencing” is decentralizing. Our data shows that Oceania and Asia experienced the highest year-over-year growth, with usage in Oceania increasing by +85.9% and Asia by +71%. NGS analysis is no longer centralized in a few western powerhouses; it is becoming a truly global endeavor.
Top TCR/BCR Sequencing Centers
Our analysis shows that the world’s leading academic and government research centers are among the heaviest users of the ecosystem. To respect the privacy of internal research pipelines, we have anonymized the specific institutions below.
Interestingly, the top 5 institutions for historical data volume are not in the top 5 for sample count. This suggests they focus on deep, complex, or large-output sequencing protocols that generate immense data per experiment, such as full-length RNA-seq or exome sequencing.
Modalities: The Dominance of Amplicon & The Rise of Single-Cell
When we look at what is being sequenced, we see a market defined by distinct tiers:
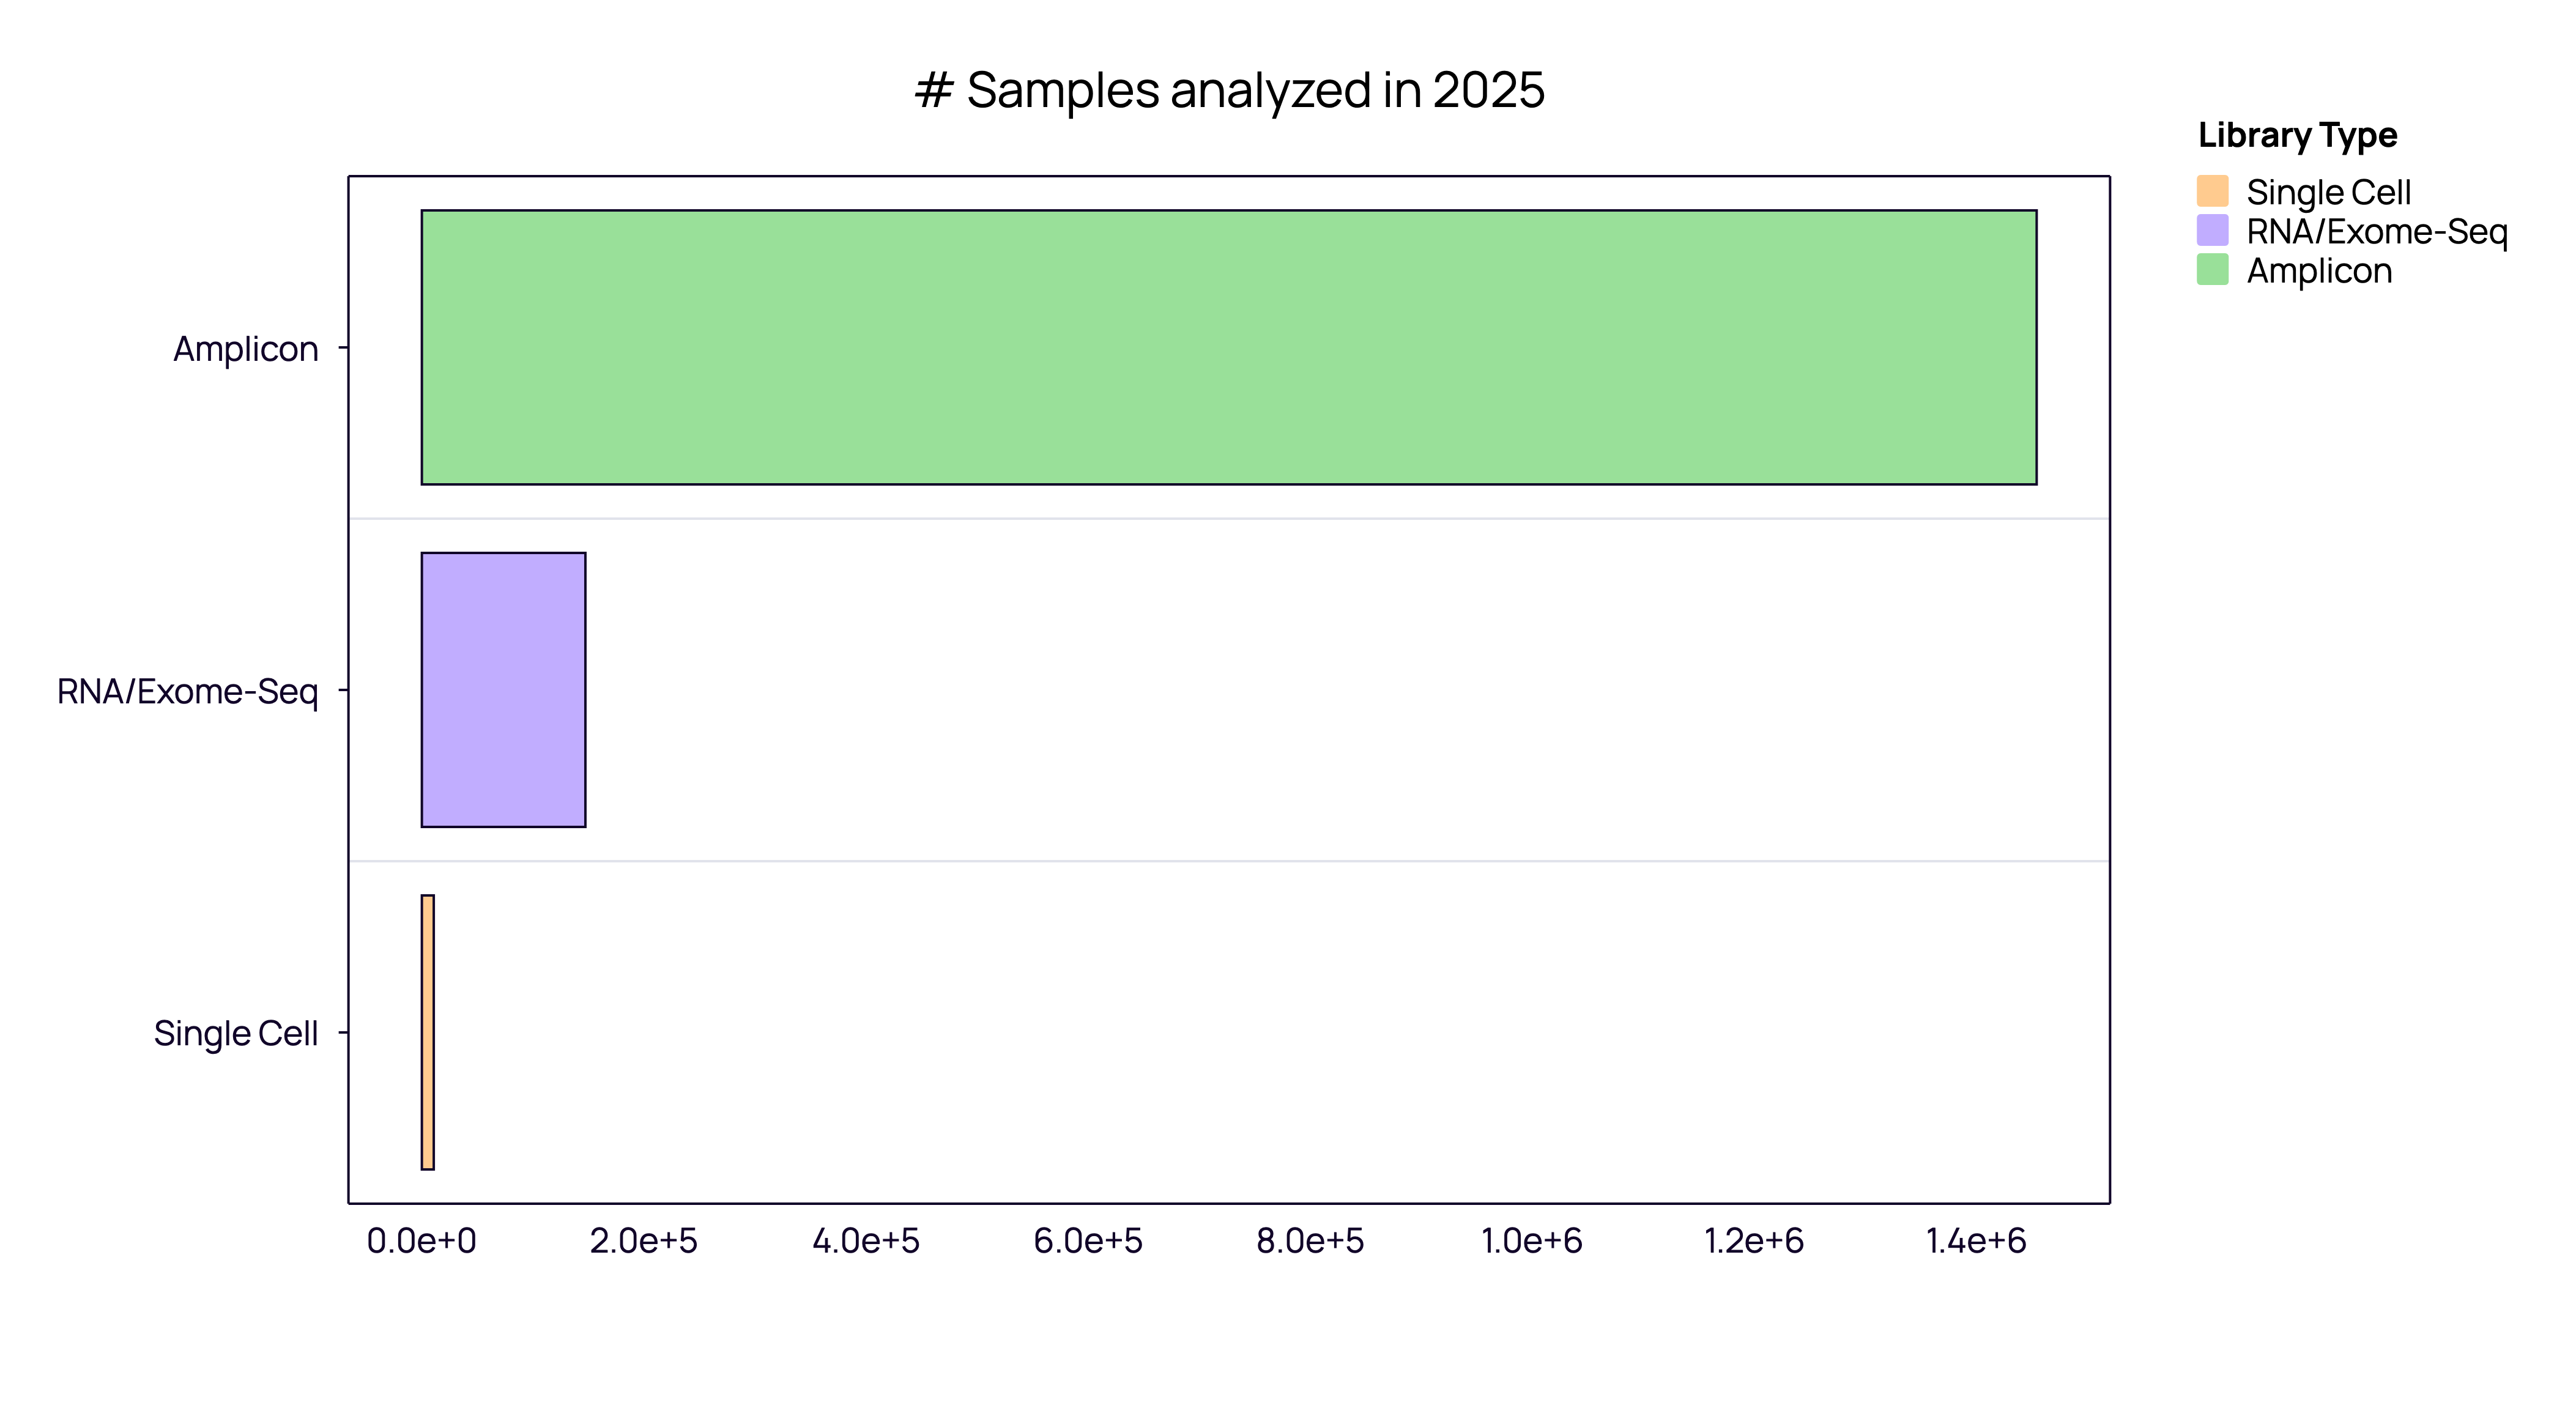
Amplicon Sequencing (The Standard): This remains the primary operational standard for 2025. For routine, high-throughput applications, bulk amplicon workflows are the undisputed workhorse, driven by cost-efficiency and scalability.
RNA/Exome Sequencing (Data Mining): This occupies a distinct second tier with approx. 10% of amplicon samples volume.
Single-Cell: in absolute terms, single-cell comprises a marginal share of the total volume. Clarification on Single-Cell metrics: to ensure clarity, our single-cell figures count ‘patient samples’ (libraries), not individual cells. If we were to count individual cells—where one sample contains ~5,000+ cells—the figures would be orders of magnitude higher. We have stuck to ‘samples’ to maintain a consistent unit of measurement across modalities.
However, volume does not equal velocity. While bulk sequencing demonstrates reliable volume stability (showing 33% year-over-year growth in our dataset), single-cell adoption is accelerating, with sample volumes growing by over 50% annually.
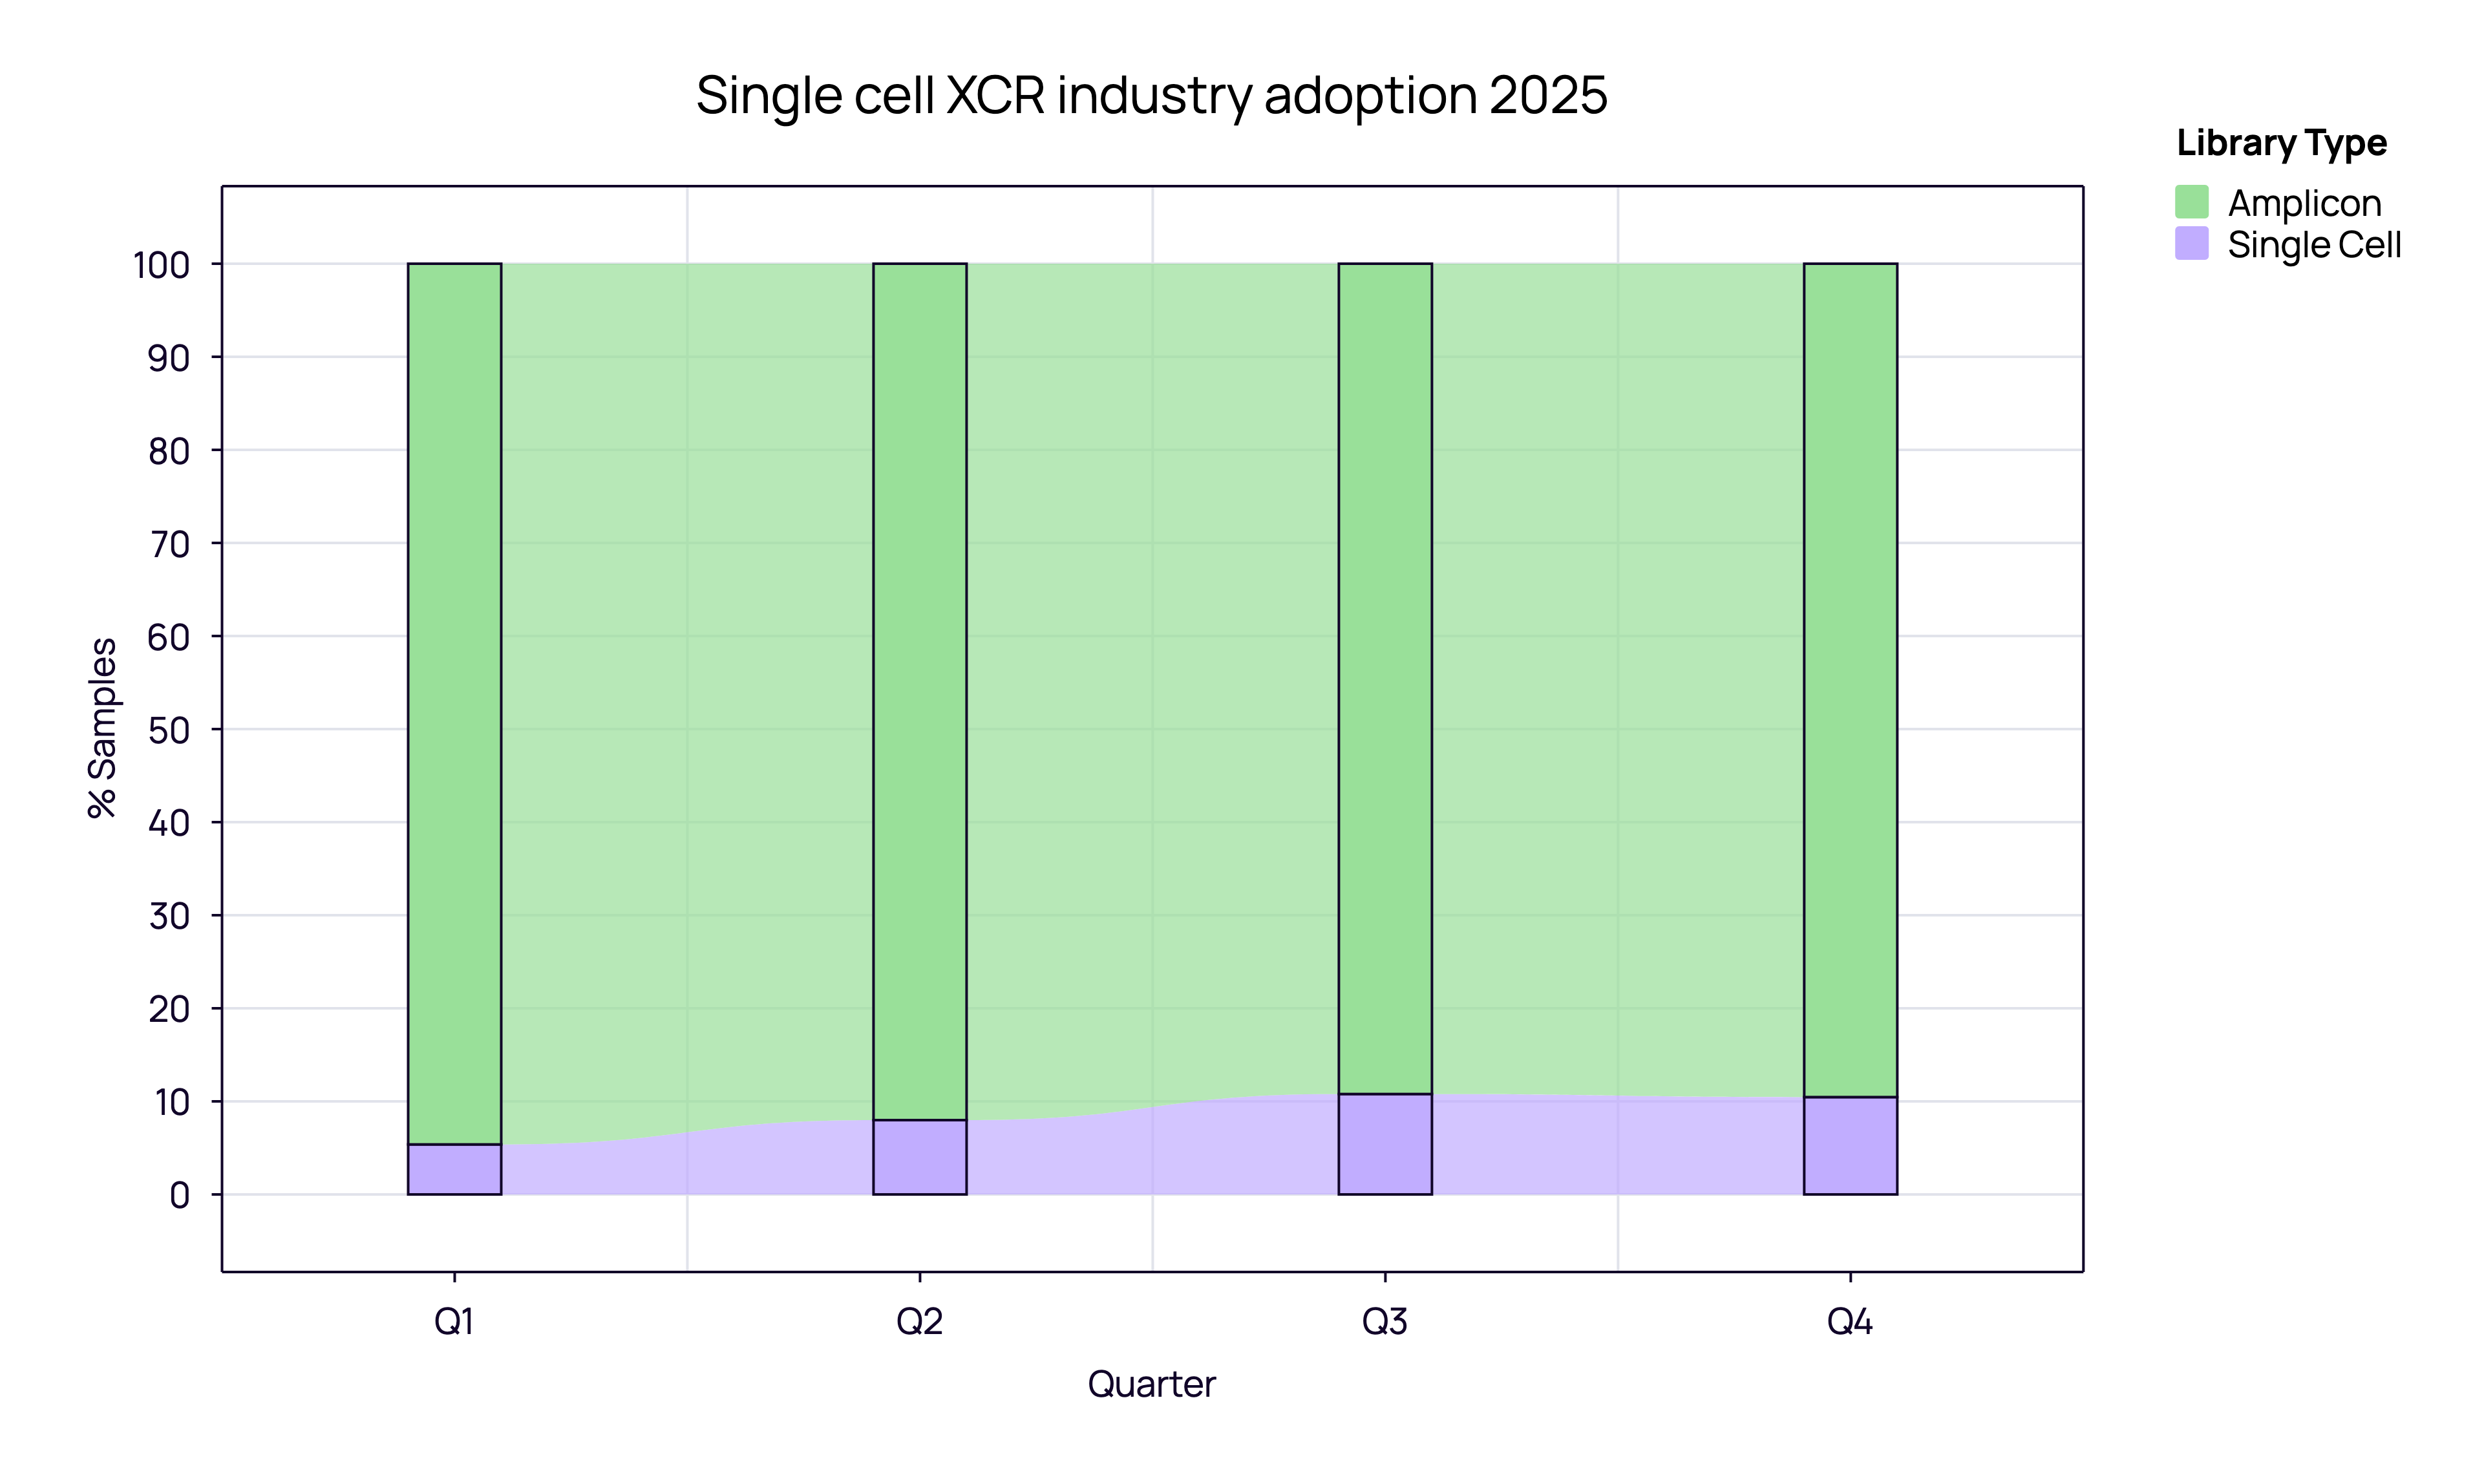
In the industrial sector specifically, we see a strategic divergence. While academia remains reliant on bulk sequencing, Industry is increasingly valuing the resolution of single-cell analysis for specific pipelines. Throughout 2025, single-cell adoption in industry shifted from ~5% in Q1 to reaching an observed 10-11% share as we close Q4.
The Strategic Divide: Make vs. Buy
One of the most striking findings in our 2025 data is the “Make vs. Buy” polarization between Academia and Industry.
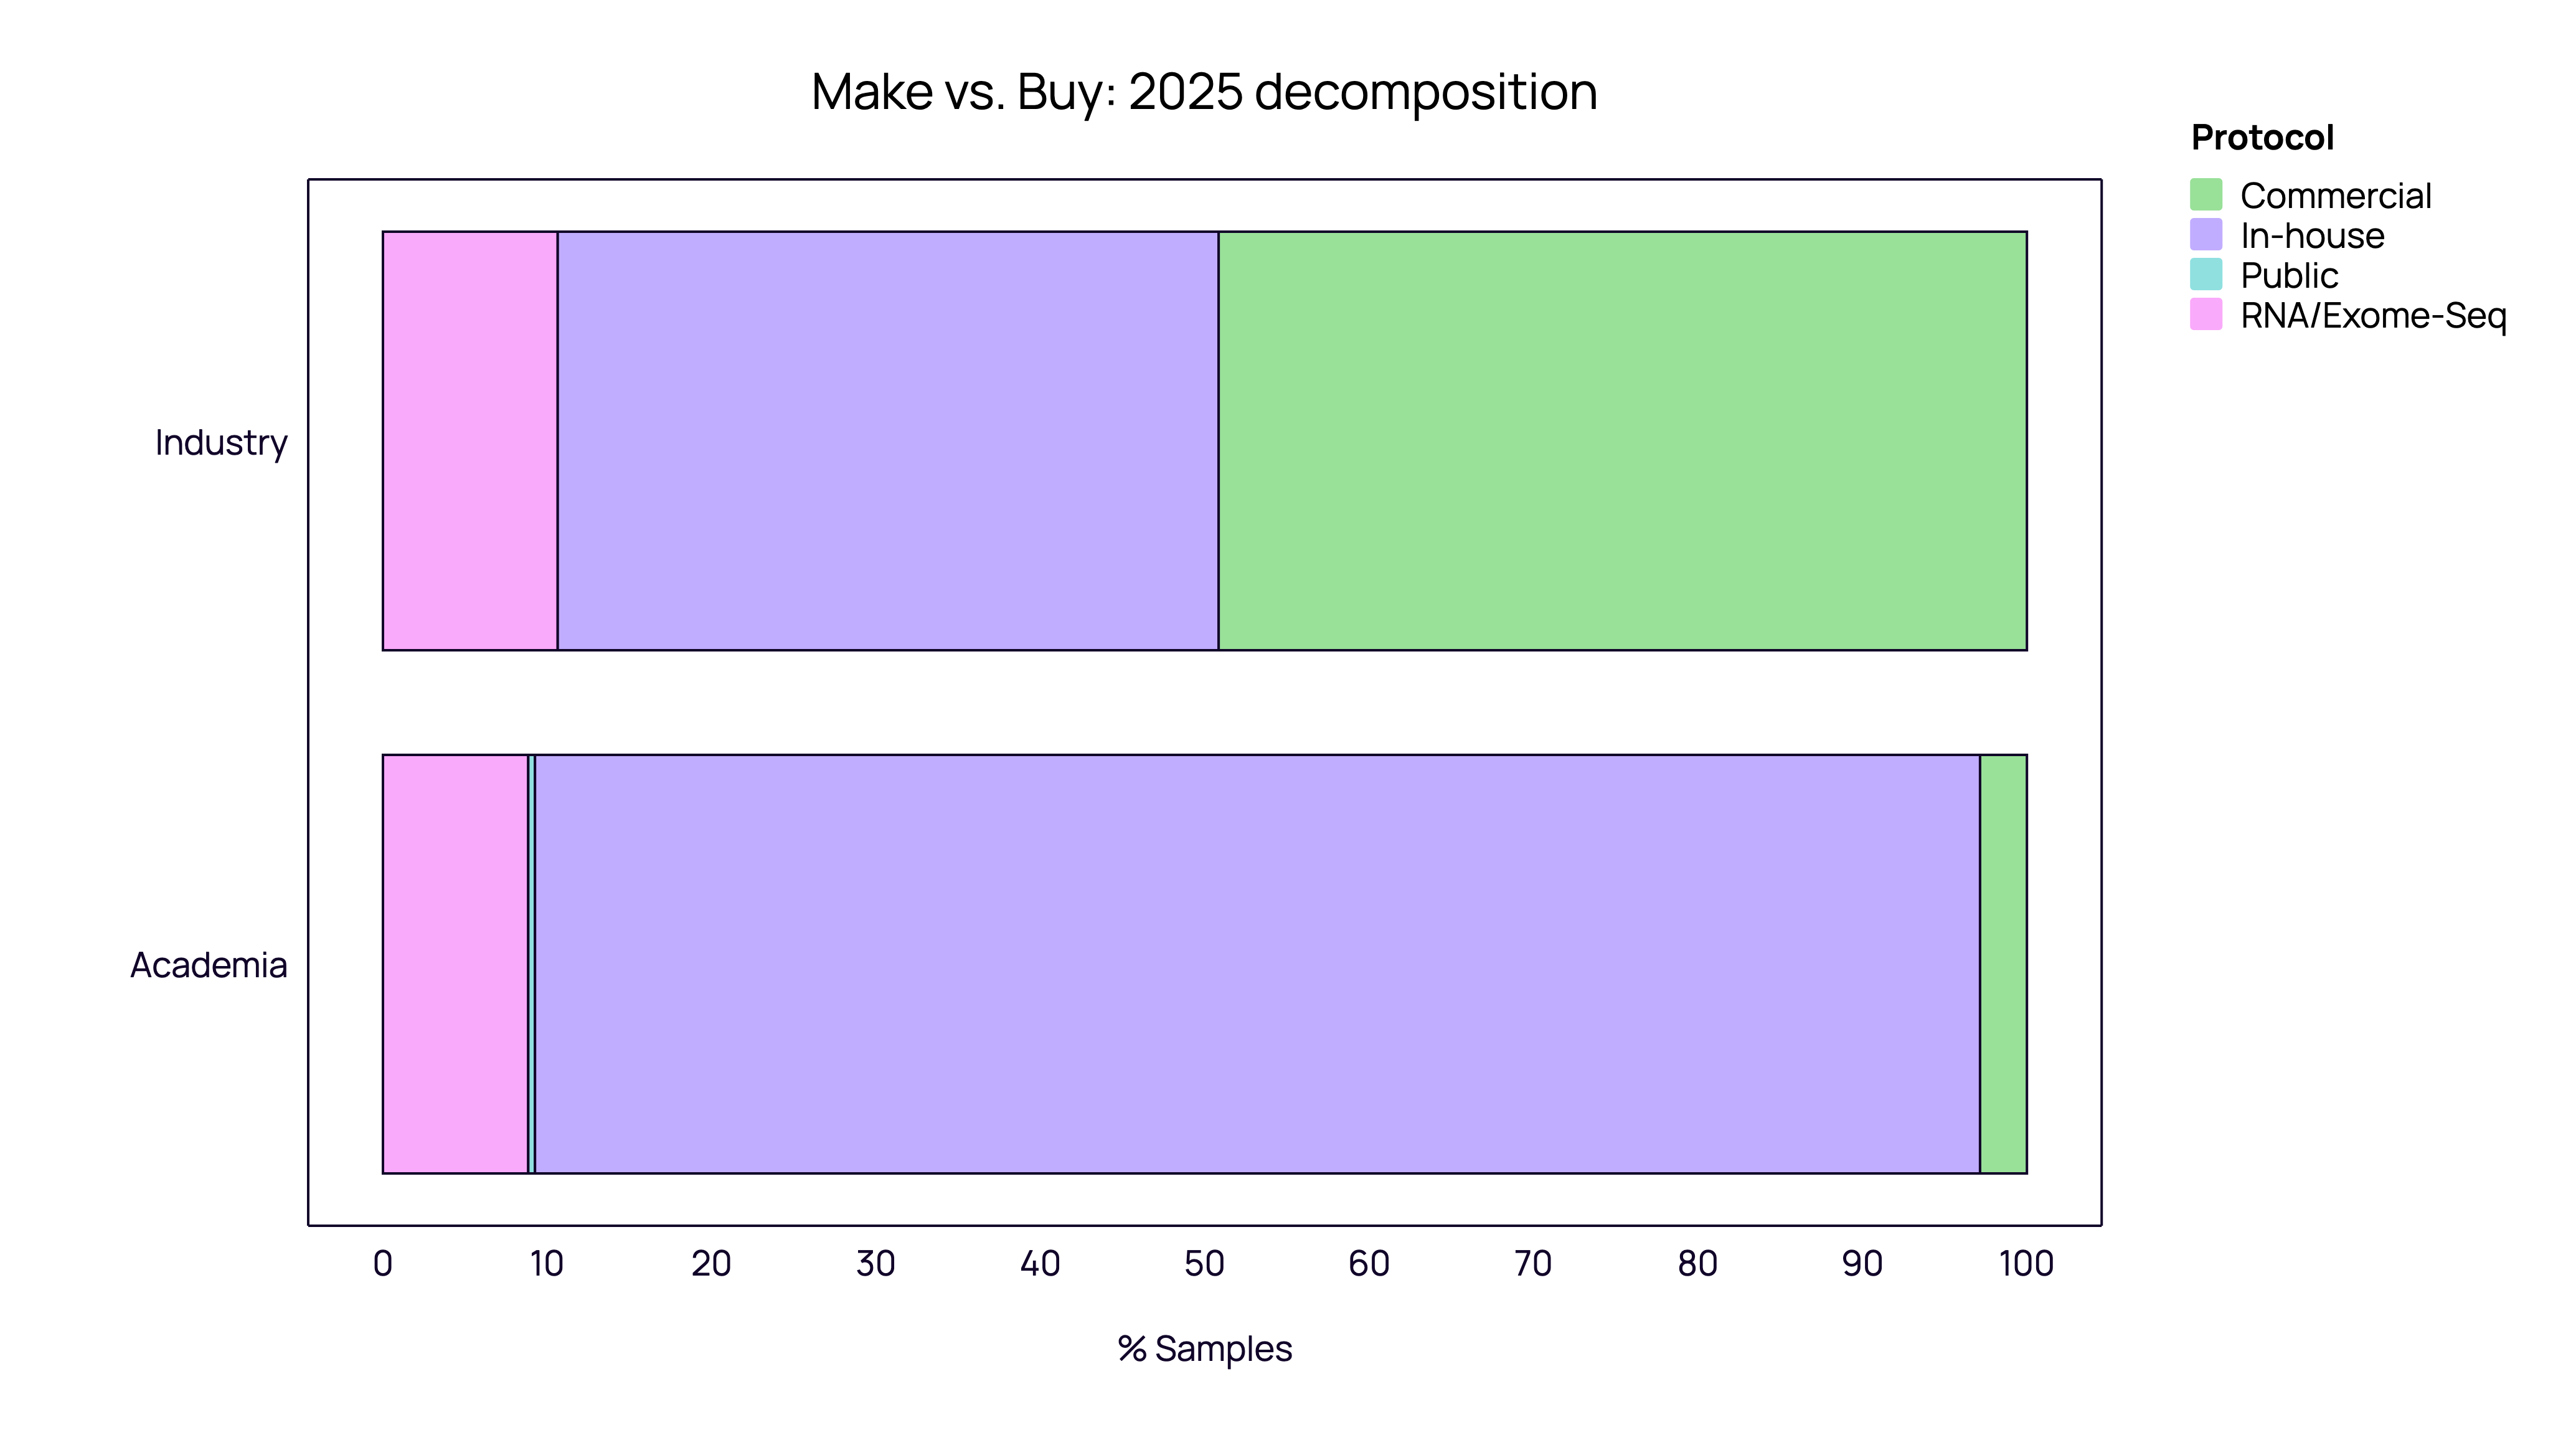
Academia: The “In-House” Retrenchment Academic institutions overwhelmingly favor in-house protocols, which account for 85-90% of their samples. Commercial kits represent a negligible fraction, likely due to cost constraints and the prevalence of custom, “home-brewed” methods. In 2025, academia appeared to double down on this strategy, with the share of commercial kits shrinking further compared to 2024.
Industry: The “Commercial” Pivot The industrial sector tells a completely different story. In 2024, industry usage within our ecosystem was roughly split between In-house and Commercial methods. However, 2025 data shows an aggressive pivot where Commercial protocols expanded to become the dominant standard among our industrial partners.
Note on Data Interpretation: This sharp trend may reflect the onboarding of specific high-volume industrial players in 2025 who favor standardized kits. However, it strongly signals that as companies scale, they prioritize the reproducibility and regulatory compatibility of commercial solutions over the cost-savings of custom assays.
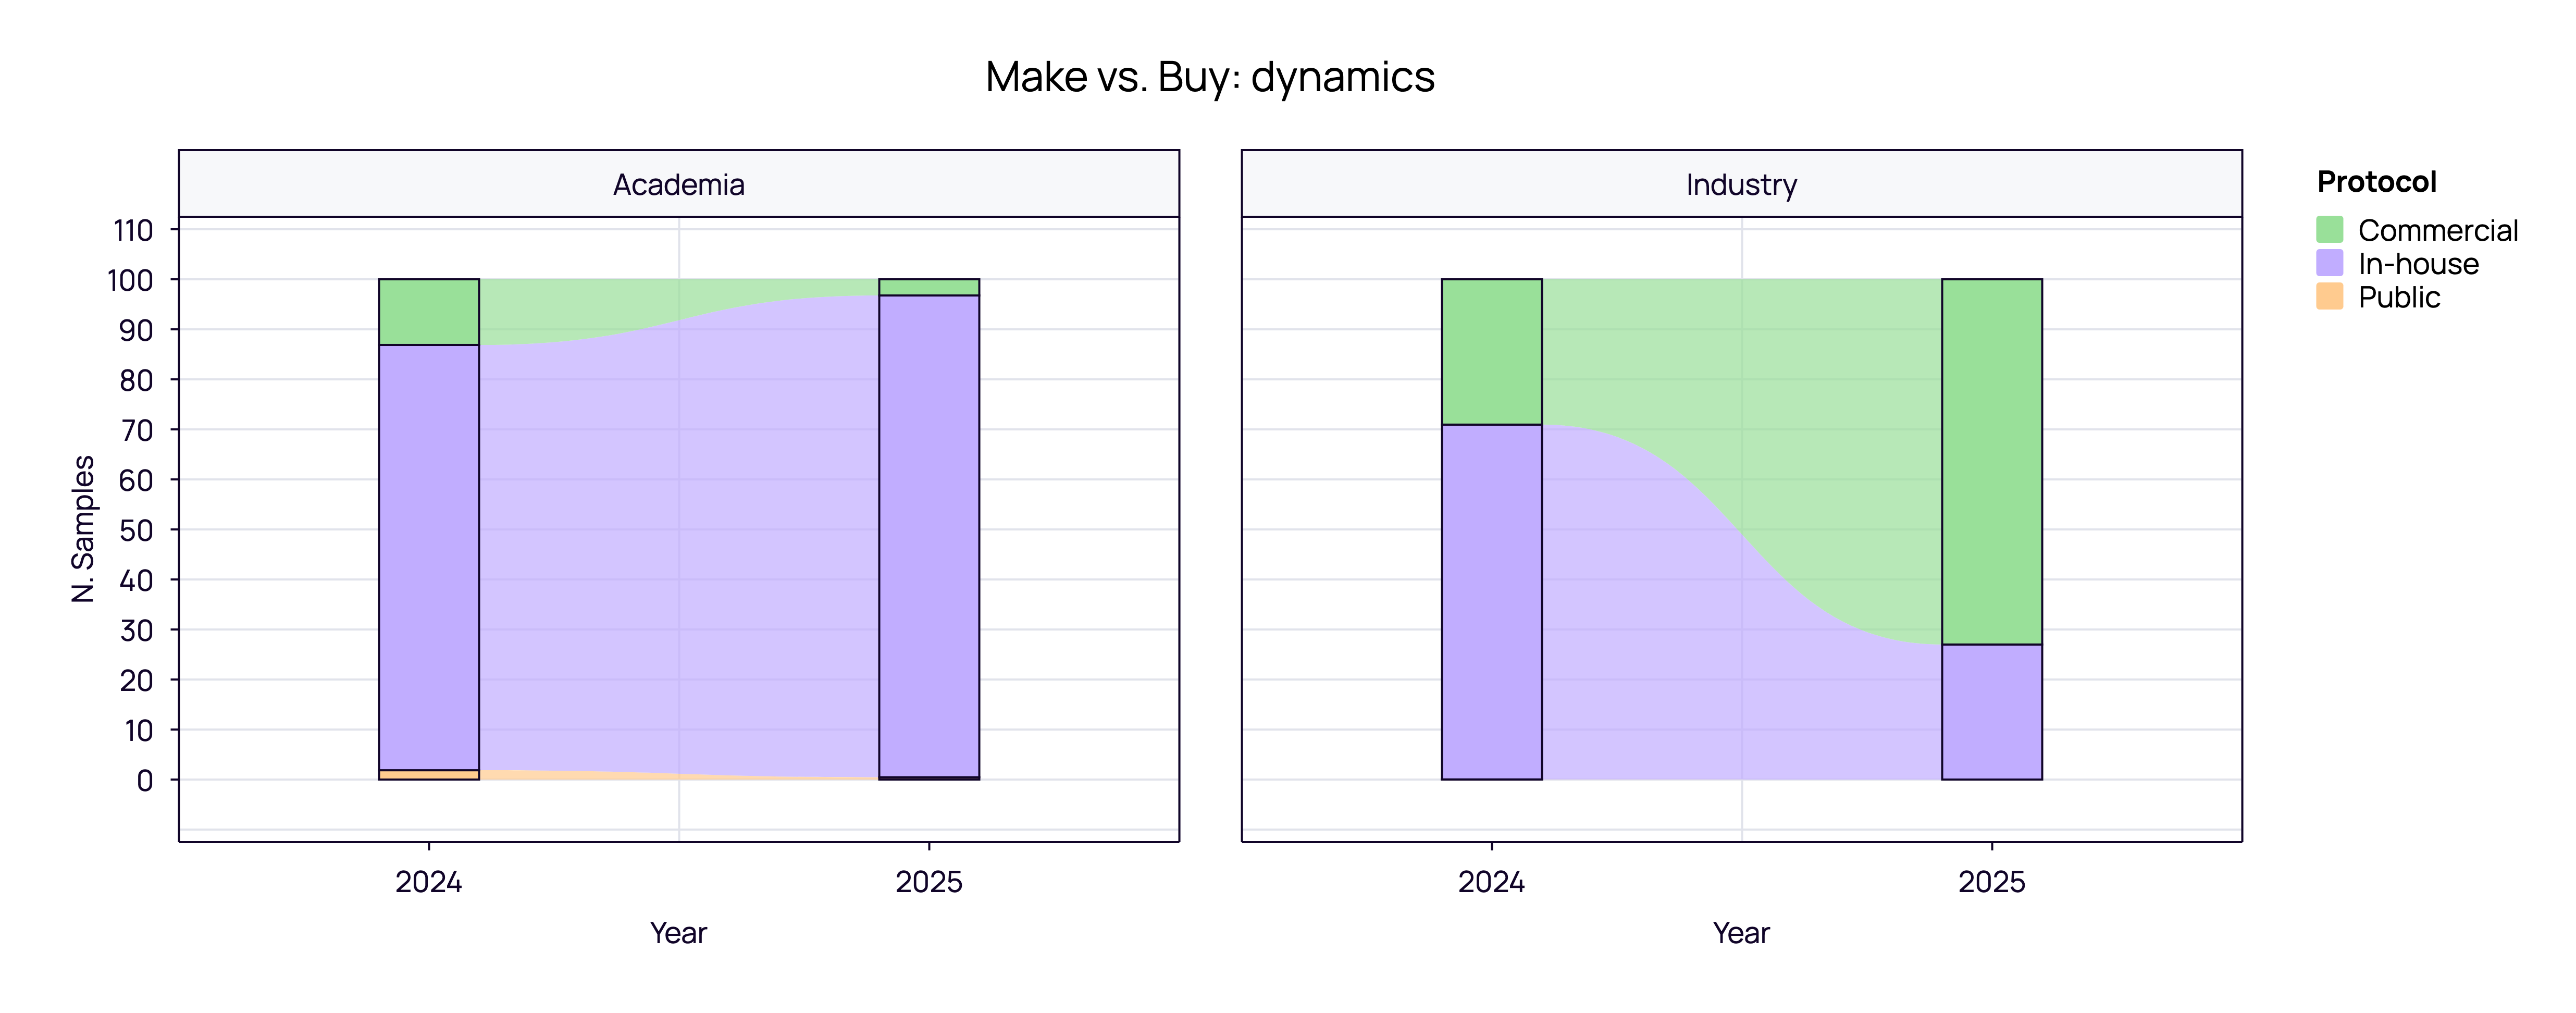
This signals a maturing industrial market that prioritizes scalability, reproducibility, and regulatory compatibility over the cost-savings of custom assays.
The Single-Cell Landscape: 10x Genomics vs. Others
When we zoom in on the single-cell segment, the vendor landscape further highlights the difference in priorities between sectors.
Industry: Efficiency and Standardization
10x Genomics commands a near-monopoly in the industrial sector, capturing 74.21% of all samples. The remaining share is largely “In-house,” with virtually no adoption of alternative commercial vendors.
Academia - Depth and Fidelity: While Academia also favors 10x Genomics (~60%), it retains a distinct sub-market for SmartSeq (~25%), a high-fidelity method virtually absent in industry.
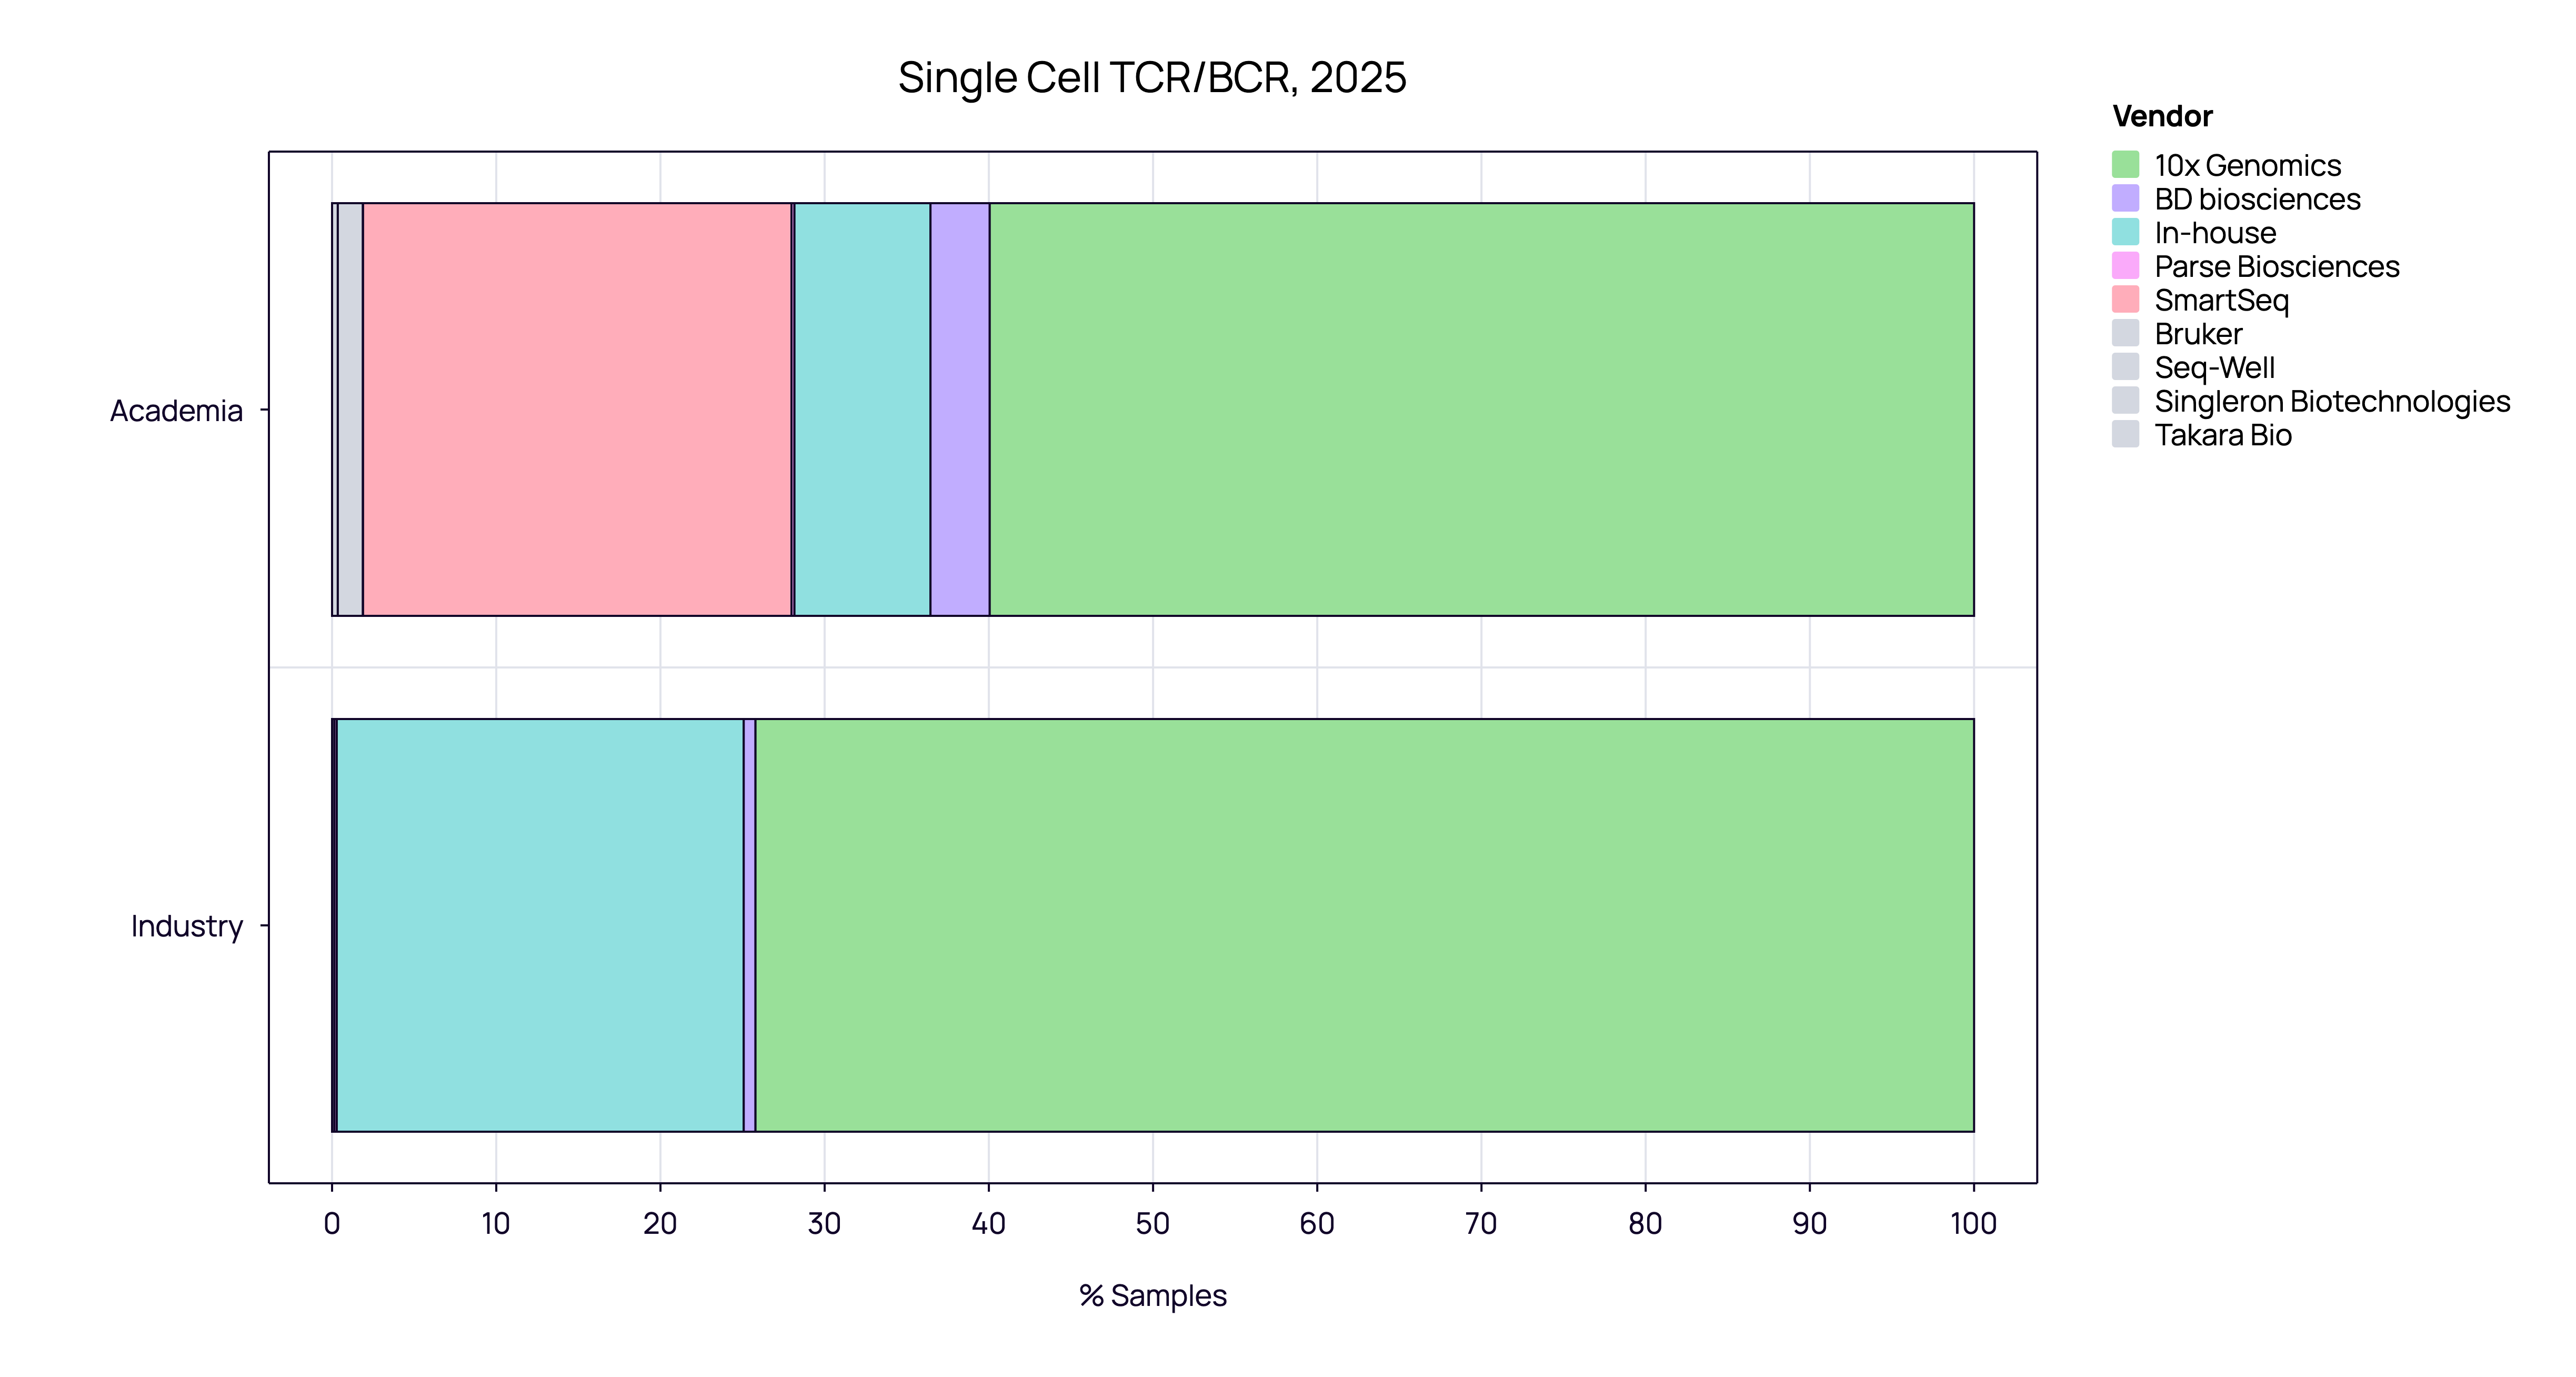
A Matter of Fit, Not Quality: This discrepancy likely isn’t about the quality of the chemistry, but rather the operational requirements of the user.
10x Genomics samples typically have a lower, consistent data footprint (median ~2-3 GB), aligning perfectly with industrial requirements for operational efficiency and predictable cloud costs.
SmartSeq samples demand significantly higher data resources (median ~20GB), reflecting the academic need for full-length transcript coverage and higher fidelity, even at the cost of storage and speed.
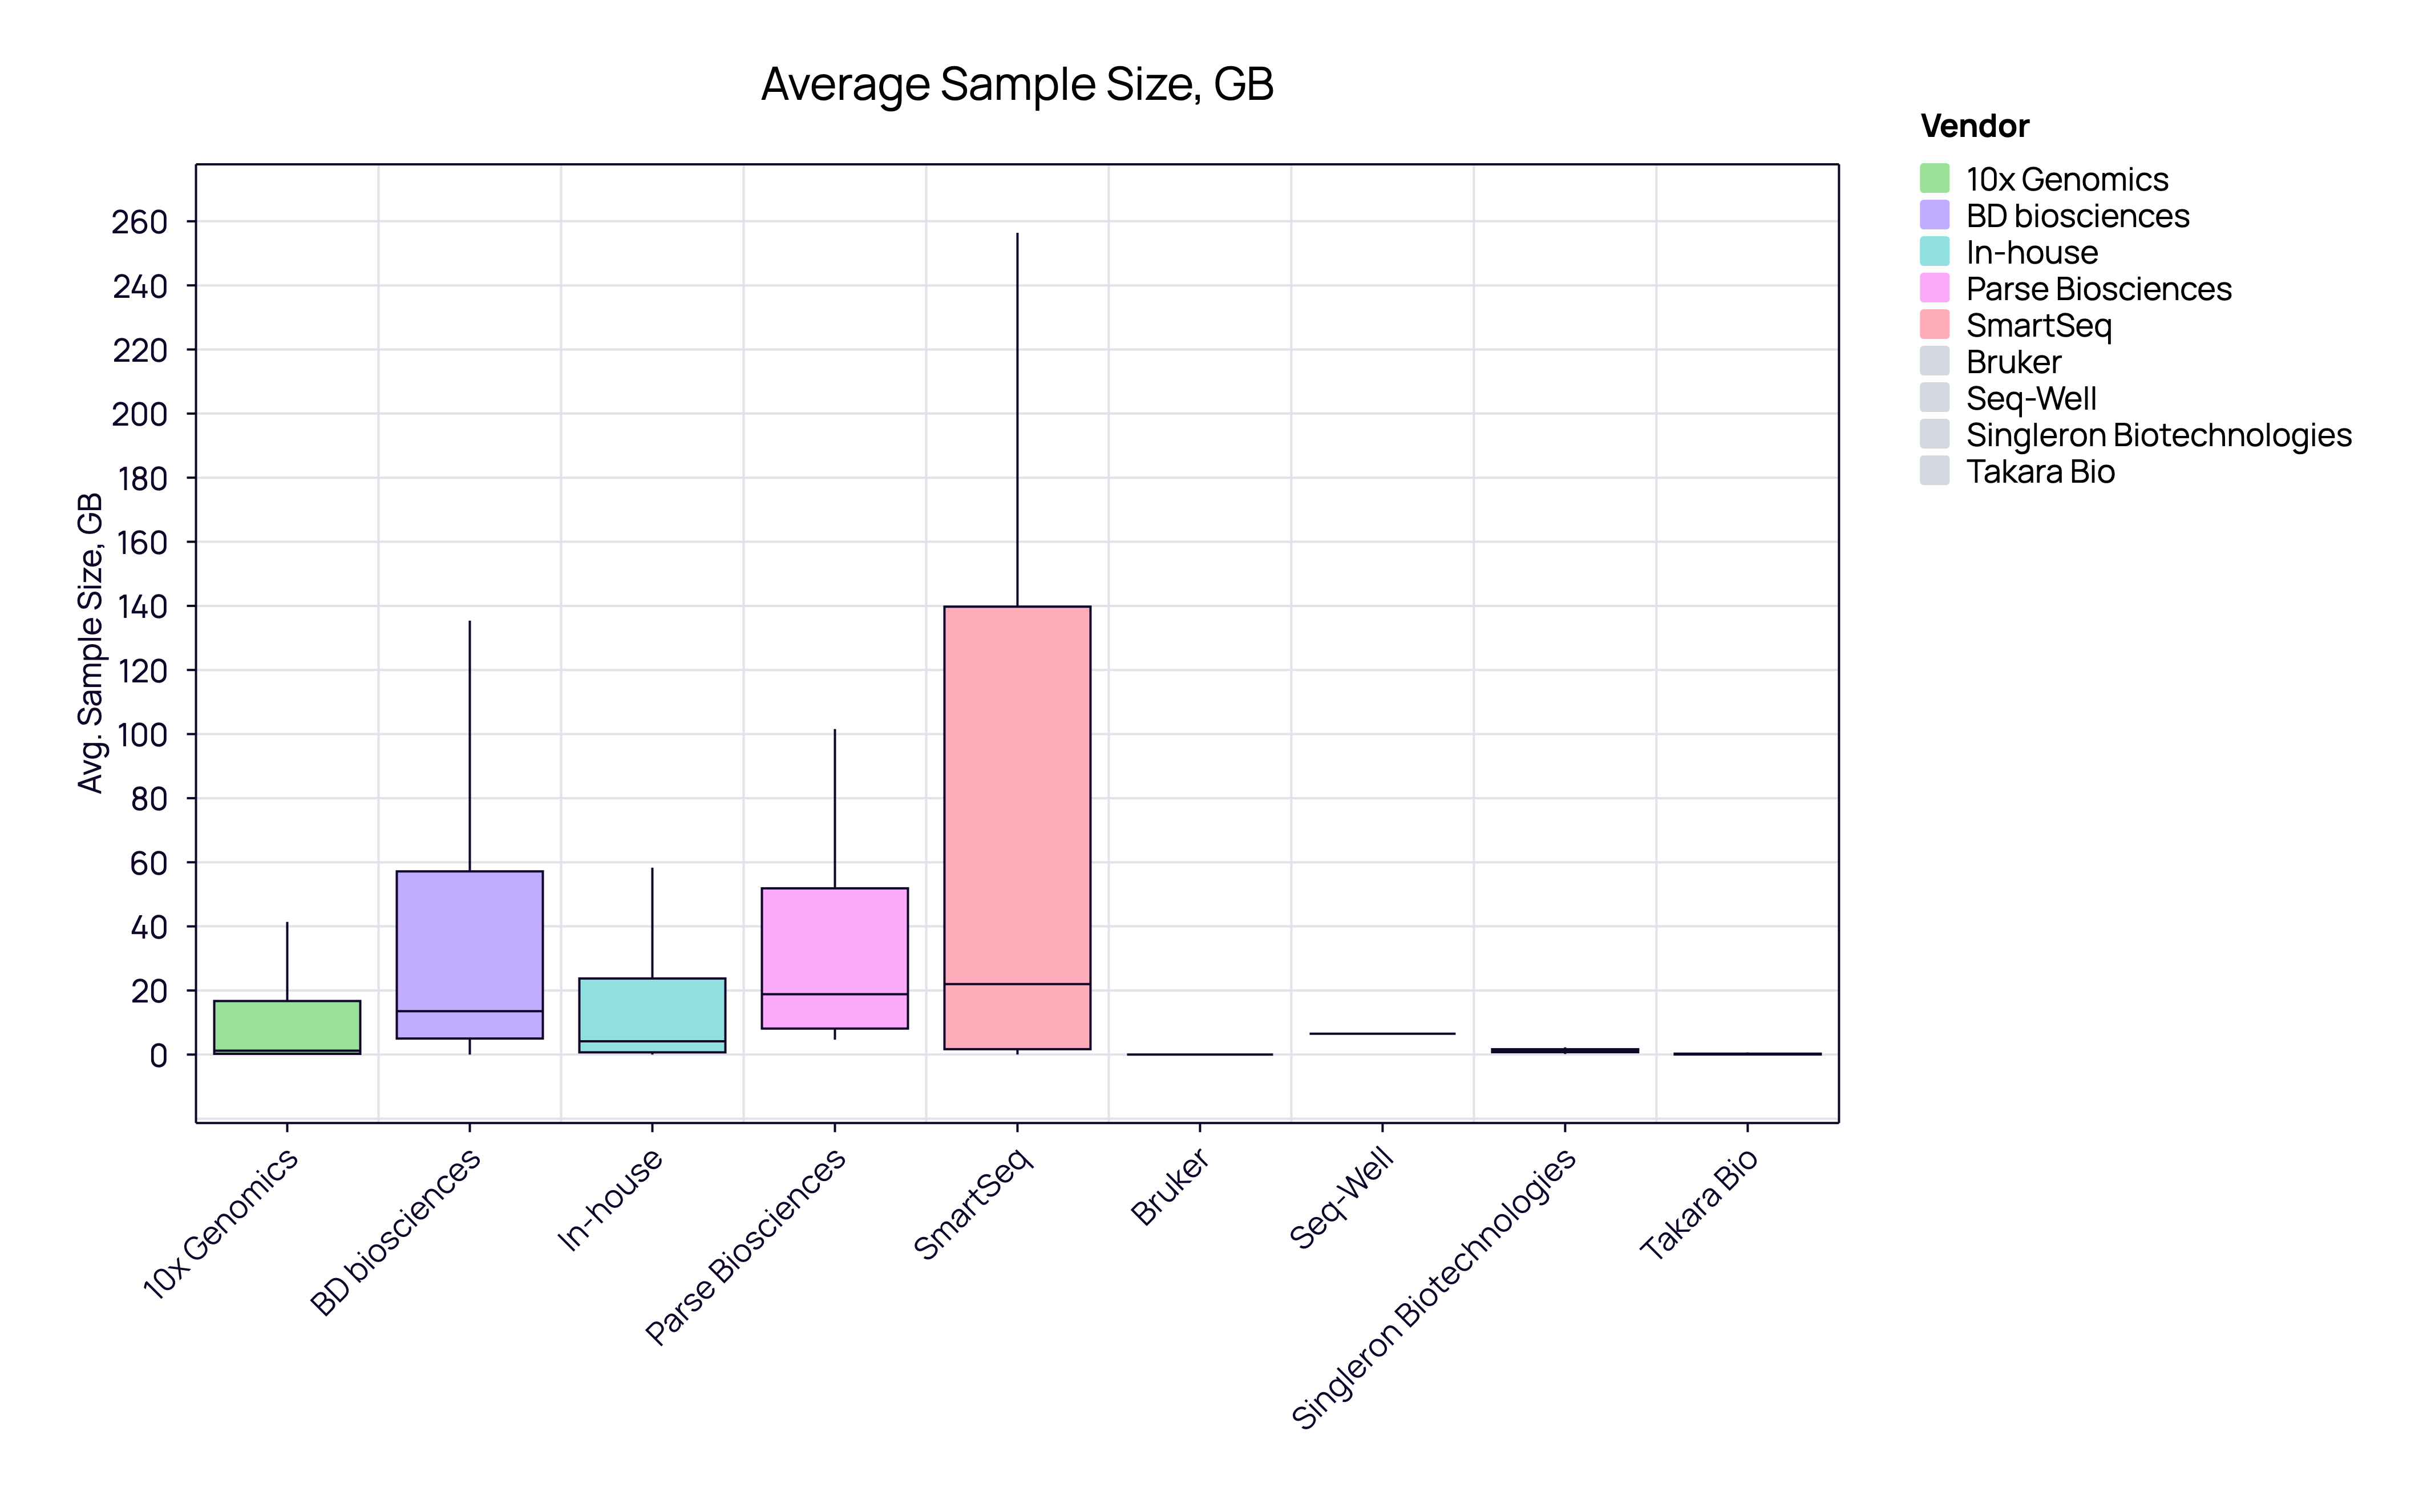
Academia’s usage of SmartSeq reflects a prioritization of sequencing depth and full-length transcript coverage over pure scalability. While ‘home-brew’ reagents are inexpensive, the requirement for deeper sequencing leads to a significantly higher total cost per cell compared to droplet-based methods.
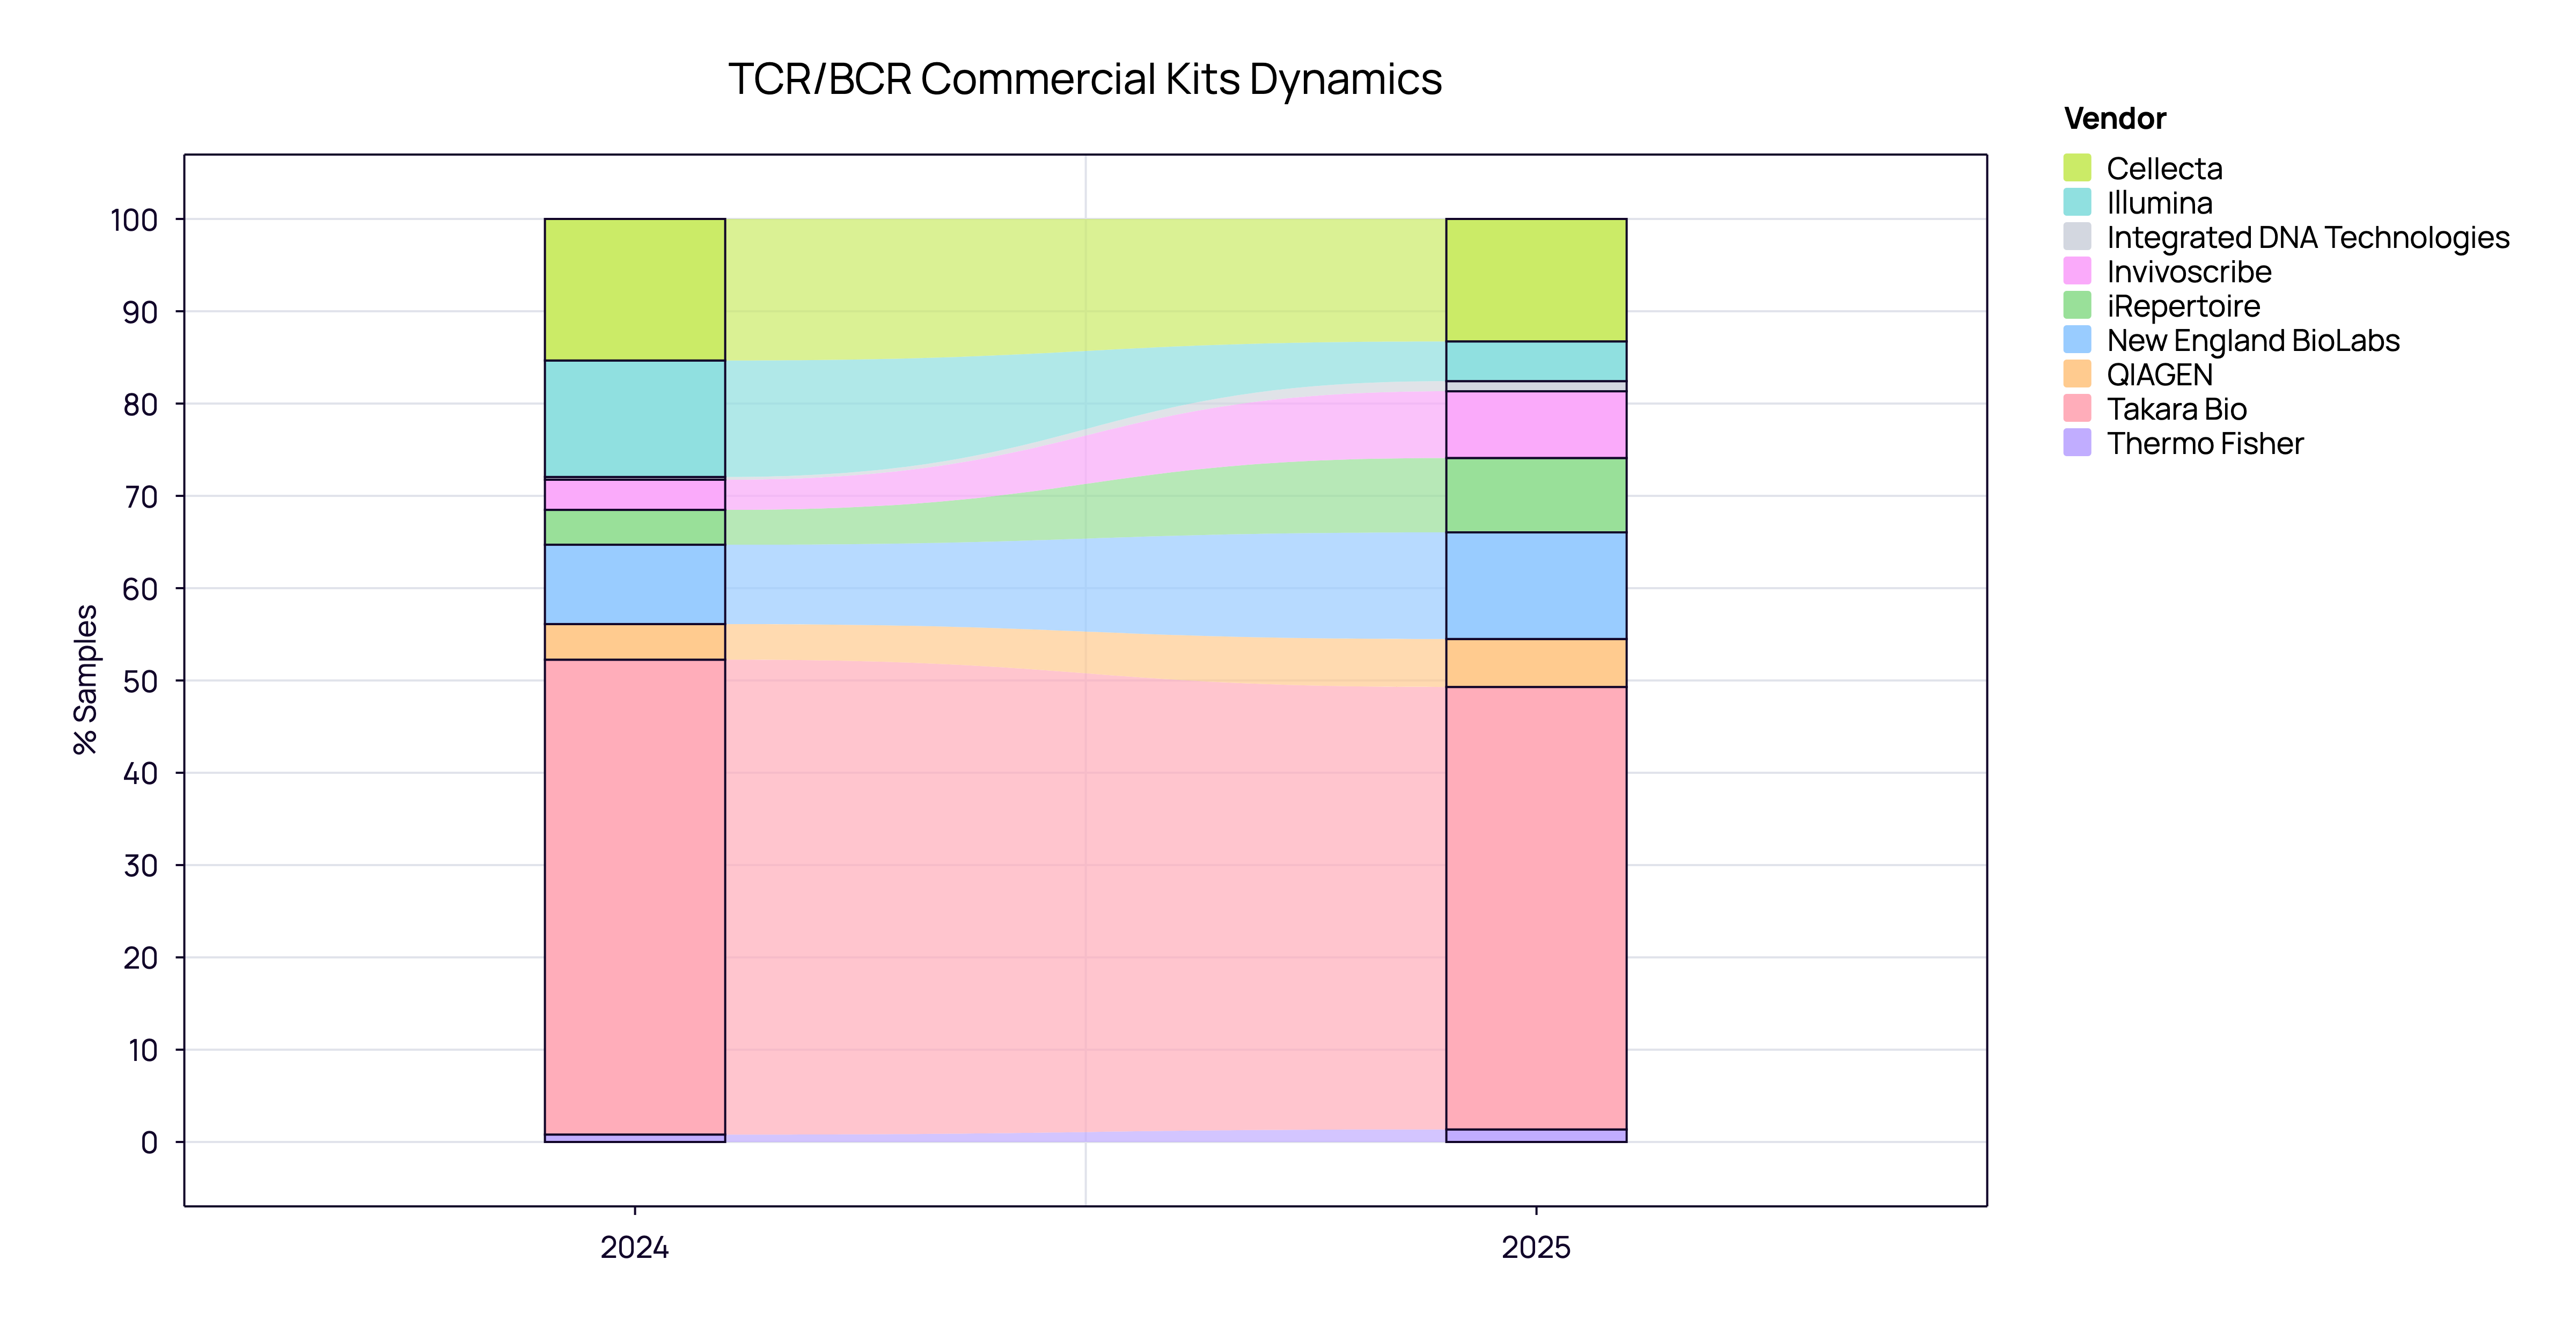
Commercial Kits: The Era of Specialization
When analyzing the commercial kit landscape (aggregated TCR and BCR), we see a market that has reached maturity. The volatile “land grab” phase appears to be over, replaced by a stable hierarchy of established players.
The Market Leader: Takara Bio retains a commanding lead, holding approximately 50% of the market share across both 2024 and 2025. Their SMARTer technology effectively remains the industry standard.
The Major Players: Cellecta and NEB maintain strong, consistent positions as the primary alternatives, showing stable adoption rates year-over-year.
The Ecosystem: Other vendors like Invivoscribe, Illumina, and iRepertoire continue to serve specific niches but show little fluctuation in total market share.
Conclusively, the 2024–2025 data reveals a “winner-takes-half” dynamic. Users have largely settled into their preferred workflows, resulting in high vendor stickiness and low churn between suppliers.
Conclusion: From Discovery to Application
The story the data tells is clear: immune repertoire analysis has matured from a niche exploratory tool into a cornerstone of modern biology.
We are witnessing a bimodal leadership structure emerge. Academia continues to drive discovery through deep, high-fidelity, and custom-designed protocols. Meanwhile, Industry is setting the direction for translation, aggressively consolidating around standardized, scalable commercial solutions (like 10x Genomics and amplicon kits) to drive real-world application.
Despite this growth, the field faces headwinds. Budgetary constraints in academia have slowed the adoption of more expensive high-fidelity protocols, and the complexity of single-cell data integration remains a bottleneck for clinical translation. However, the industry’s shift toward standardization suggests these hurdles are being actively addressed.
As we move into the next era of immune profiling, the focus will shift from simple data accumulation to integration—combining bulk structure with single-cell resolution to decode the immune system with unprecedented clarity.